<?xml version="1.0" encoding="utf-8"?><feed xmlns="http://www.w3.org/2005/Atom" ><generator uri="https://jekyllrb.com/" version="3.10.0">Jekyll</generator><link href="https://sudshu.github.io/feed.xml" rel="self" type="application/atom+xml" /><link href="https://sudshu.github.io/" rel="alternate" type="text/html" /><updated>2026-10-01T21:22:25+00:00</updated><id>https://sudshu.github.io/feed.xml</id><title type="html">Sudhanshu Pandey</title><subtitle>Scientist at NASA&apos;s Jet Propulsion Laboratory studying greenhouse gases, air quality, and the carbon cycle with satellite observations, atmospheric models, and machine learning.</subtitle><author><name>Sudhanshu Pandey</name></author><entry><title type="html">The Tale of the Traveling CO₂</title><link href="https://sudshu.github.io/2026/09/30/tale-of-the-traveling-co2.html" rel="alternate" type="text/html" title="The Tale of the Traveling CO₂" /><published>2026-09-30T00:00:00+00:00</published><updated>2026-09-30T00:00:00+00:00</updated><id>https://sudshu.github.io/2026/09/30/tale-of-the-traveling-co2</id><content type="html" xml:base="https://sudshu.github.io/2026/09/30/tale-of-the-traveling-co2.html"><![CDATA[<p>I wrote this poem in July 2025. It is about a question behind my work on CO<sub>2</sub> growth rates: how the long, careful record from surface stations compares with the fast, global view from satellites.</p>

<div class="poem">
<p><span class="line">In a quiet town, a CO<sub>2</sub> did reside,</span><span class="line">Dreaming of adventures and the world outside.</span><span class="line">She yearned to see Hawaii’s distant shore, 🏝️</span><span class="line">Where Mr. In Situ awaited—perfect to his core.</span></p>
<p><span class="line">Determined and eager, she caught a train, 🚆</span><span class="line">Hoping the journey wouldn’t be in vain.</span><span class="line">But fate had plans she didn’t foresee;</span><span class="line">She boarded the wrong one, not where wished to be.</span></p>
<p><span class="line">In the stratosphere, time moved slow,</span><span class="line">Trains were scarce, with nowhere to go.</span><span class="line">She waited and pondered under the sky so blue,</span><span class="line">Until she met OCO—fast and new. 🚀</span></p>
<p><span class="line">OCO was swift, full of energy and light, ⚡</span><span class="line">Circling the Earth in a swift flight. 🌎</span><span class="line">“I’ll meet you daily,” he’d often declare,</span><span class="line">But clouds and rain would keep him elsewhere. ☁️🌧️</span></p>
<p><span class="line">Sometimes he’d vanish for weeks on end,</span><span class="line">Leaving CO<sub>2</sub> without her friend.</span><span class="line">Yet slowly he improved, braving the rain, ☔</span><span class="line">Making efforts not to disappear again.</span></p>
<p><span class="line">After two long years, a train arrived at last, 🚆</span><span class="line">CO<sub>2</sub> hopped aboard, leaving the past.</span><span class="line">She reached Hawaii’s shores so grand,</span><span class="line">And met Mr. In Situ upon the sand. 🏖️</span></p>
<p><span class="line">He came from royalty, a noble line,</span><span class="line">His family’s legacy stood the test of time. ⌛</span><span class="line">Accurate and steady, a reliable guide, 📏</span><span class="line">CO<sub>2</sub> admired him, standing by his side.</span></p>
<p><span class="line">Now she faces a choice that’s tough and true:</span><span class="line">Fast-paced OCO 🚀 or Mr. In Situ? 🏖️</span></p>
</div>

<h2 id="the-science-behind-the-poem">The science behind the poem</h2>

<p>Mr. In Situ stands for surface measurements such as the record at Mauna Loa, Hawaii, which Charles David Keeling started in 1958. OCO is NASA’s Orbiting Carbon Observatory-2, which measures CO<sub>2</sub> around the globe but cannot see through clouds. The slow trains of the stratosphere stand for how long air can stay up there before it comes back down.</p>

<p>For the science, see <a href="https://doi.org/10.1029/2023AV001145">Pandey et al. (2024), <em>AGU Advances</em></a>, which compares the sampling errors of satellite and in situ approaches. More on this work is in <a href="/#co2-growth-rate">Research</a>.</p>]]></content><author><name>Sudhanshu Pandey</name></author><summary type="html"><![CDATA[A short poem about measuring CO₂ from the ground and from space, with a note on the science behind it.]]></summary><media:thumbnail xmlns:media="http://search.yahoo.com/mrss/" url="https://sudshu.github.io/assets/social/card.png" /><media:content medium="image" url="https://sudshu.github.io/assets/social/card.png" xmlns:media="http://search.yahoo.com/mrss/" /></entry><entry><title type="html">The adjoint used to be a PhD. Now it’s one line of JAX.</title><link href="https://sudshu.github.io/2026/07/02/free-adjoint-jax-inverse-modeling.html" rel="alternate" type="text/html" title="The adjoint used to be a PhD. Now it’s one line of JAX." /><published>2026-07-02T00:00:00+00:00</published><updated>2026-07-02T00:00:00+00:00</updated><id>https://sudshu.github.io/2026/07/02/free-adjoint-jax-inverse-modeling</id><content type="html" xml:base="https://sudshu.github.io/2026/07/02/free-adjoint-jax-inverse-modeling.html"><![CDATA[<style>
  .iw-card{
    --ink:#1b1d1f; --muted:#68707a; --panel:#f6f8fa; --border:#e2e6ea;
    --green:#2f6b2c; --red:#c0392b; --steel:#37618e; --amber:#d97706;
    --mono:ui-monospace,SFMono-Regular,Menlo,Consolas,monospace;
    font-family:-apple-system,BlinkMacSystemFont,"Segoe UI",Roboto,Helvetica,Arial,sans-serif;
    color:var(--ink); line-height:1.55; -webkit-font-smoothing:antialiased;
  }
  .iw-card *{box-sizing:border-box;}

  .iw-card{
    border:1px solid var(--border); border-radius:12px; background:#fff;
    padding:20px 20px 18px; margin:22px 0;
    box-shadow:0 1px 2px rgba(20,25,35,.04), 0 8px 24px -18px rgba(20,25,35,.18);
  }
  .iw-eyebrow{
    text-transform:uppercase; letter-spacing:.12em; font-size:10.5px; font-weight:700;
    color:var(--amber); margin:0 0 4px;
  }
  .iw-title{font-size:18px; font-weight:650; margin:0 0 3px; letter-spacing:-.01em;}
  .iw-note{color:var(--muted); font-size:13.5px; margin:0 0 16px;}
  .iw-caption{color:var(--muted); font-size:12.5px; font-style:italic; margin:14px 2px 0; line-height:1.5;}

  .iw-panel{background:var(--panel); border:1px solid var(--border); border-radius:8px; padding:10px;}
  .iw-canvases{display:flex; gap:12px;}
  .iw-canvases > div{flex:1 1 0; min-width:0;}
  .iw-cv-label{font-size:11px; color:var(--muted); font-weight:600; margin:0 0 6px 2px; letter-spacing:.02em;}
  canvas.iw{display:block; width:100%; border-radius:5px; touch-action:manipulation;}

  .iw-controls{display:flex; flex-wrap:wrap; gap:10px 14px; align-items:center; margin-top:14px;}
  .iw-sliderbox{display:flex; flex-direction:column; gap:3px; flex:1 1 220px; min-width:180px;}
  .iw-sliderbox label{font-size:11.5px; color:var(--muted); font-weight:600; display:flex; justify-content:space-between; gap:8px;}
  .iw-sliderbox label b{color:var(--ink); font-family:var(--mono); font-variant-numeric:tabular-nums; font-weight:600;}
  input[type=range].iw{-webkit-appearance:none; appearance:none; width:100%; height:5px; border-radius:3px; background:var(--border); outline:none; margin:6px 0;}
  input[type=range].iw::-webkit-slider-thumb{-webkit-appearance:none; appearance:none; width:17px; height:17px; border-radius:50%; background:var(--amber); border:2px solid #fff; box-shadow:0 1px 3px rgba(0,0,0,.28); cursor:pointer;}
  input[type=range].iw::-moz-range-thumb{width:15px; height:15px; border-radius:50%; background:var(--amber); border:2px solid #fff; box-shadow:0 1px 3px rgba(0,0,0,.28); cursor:pointer;}
  input[type=range].iw:focus-visible{box-shadow:0 0 0 3px rgba(217,119,6,.3);}

  button.iw{
    font:inherit; font-size:13px; font-weight:600; padding:8px 13px; border-radius:7px;
    border:1px solid var(--border); background:#fff; color:var(--ink); cursor:pointer;
    transition:background .12s, border-color .12s, transform .04s;
  }
  button.iw:hover{background:var(--panel); border-color:#cfd5db;}
  button.iw:active{transform:translateY(1px);}
  button.iw:focus-visible{outline:none; box-shadow:0 0 0 3px rgba(217,119,6,.3);}
  button.iw.primary{background:var(--ink); color:#fff; border-color:var(--ink);}
  button.iw.primary:hover{background:#000;}
  button.iw:disabled{opacity:.45; cursor:default; transform:none;}

  .iw-stat{font-family:var(--mono); font-variant-numeric:tabular-nums; font-size:12.5px;}
  select.iw{font:inherit; font-size:12.5px; padding:6px 8px; border-radius:6px; border:1px solid var(--border); background:#fff; color:var(--ink);}

  @media (max-width:560px){
    .iw-canvases{flex-direction:column;}
  }
  @media (prefers-reduced-motion:reduce){
    button.iw{transition:none;}
  }
</style>

<section class="iw-card" id="iw-fit">
  <p class="iw-eyebrow">Interactive · what this whole post is about</p>
  <p class="iw-title">Let the gradient fit the curve</p>
  <p class="iw-note">The dots are data, blurred by a hidden amount <b>κ</b>. The amber curve is a model that
  starts with the <em>wrong</em> κ — too sharp — and the shaded band is how badly it misses. Press
  <em>Solve</em> (or just watch) and a gradient walks κ until the curve lands on the dots and the mismatch vanishes.</p>
  <div class="iw-panel"><canvas class="iw" id="fit-canvas"></canvas></div>
  <div class="iw-controls">
    <div class="iw-sliderbox">
      <label for="fit-slider">blur strength κ <b id="fit-kval">0.0035</b></label>
      <input type="range" class="iw" id="fit-slider" min="0" max="1" step="0.001" value="0.10" />
    </div>
    <button class="iw primary" id="fit-solve">Solve ▸</button>
    <button class="iw" id="fit-new">New data</button>
  </div>
  <p class="iw-stat" id="fit-status" style="margin-top:12px; color:var(--muted);">mismatch J = — · step 0</p>
  <p class="iw-caption">That is the entire inverse problem in one picture: a wrong model, some data, and a
  gradient that knows which way to nudge the unknown. This post is about where that gradient comes from — and why
  the same one line of code (<code>jax.grad</code>) works whether there is one unknown here or a million in a
  real satellite flux inversion.</p>
</section>
<script>
(function(){
  var N=110, M=64, SCALE=9;
  function u0(){var u=new Float64Array(N),i;for(i=0;i<N;i++){var x=i/N;
    u[i]=0.95*Math.exp(-(Math.pow((x-0.34)/0.07,2)))+0.62*Math.exp(-(Math.pow((x-0.66)/0.05,2)));}return u;}
  var U0=u0();
  function forward(k){var d=SCALE*k,u=U0.slice(),t,i,nu;
    for(t=0;t<M;t++){nu=new Float64Array(N);for(i=0;i<N;i++){var l=u[(i-1+N)%N],r=u[(i+1)%N];nu[i]=u[i]+d*(l-2*u[i]+r);}u=nu;}return u;}
  var KMIN=0.002,KMAX=0.05;
  function s2k(s){return KMIN*Math.pow(KMAX/KMIN,s);}
  function k2s(k){return Math.log(k/KMIN)/Math.log(KMAX/KMIN);}
  var kTrue,uobs,kGuess,step=0,converged=false,anim=null,playing=false,userTouched=false;
  function lossOf(k){var u=forward(k),s=0,i;for(i=0;i<N;i++){var e=u[i]-uobs[i];s+=e*e;}return s/N;}
  var cv=document.getElementById('fit-canvas');
  var _dpr=Math.min(window.devicePixelRatio||1,2);
  function fit(h){var w=cv.clientWidth||600,W=Math.round(w*_dpr),Hh=Math.round(h*_dpr);
    if(cv.width!==W||cv.height!==Hh){cv.width=W;cv.height=Hh;cv.style.height=h+'px';}
    var c=cv.getContext('2d');c.setTransform(_dpr,0,0,_dpr,0,0);return{c:c,w:w,h:h};}
  function trace(c,arr,gx,gy){c.beginPath();for(var i=0;i<arr.length;i++){var X=gx(i),Y=gy(arr[i]);i?c.lineTo(X,Y):c.moveTo(X,Y);}}
  function draw(){
    if((cv.clientWidth||0)<20)return;
    var o=fit(224),c=o.c,w=o.w,h=o.h,padL=12,padR=12,padT=18,padB=14,i;
    c.clearRect(0,0,w,h);
    var yMax=1.05,gx=function(i){return padL+(i/(N-1))*(w-padL-padR);},gy=function(v){return padT+(1-v/yMax)*(h-padT-padB);};
    c.strokeStyle='#e2e6ea';c.lineWidth=1;c.beginPath();c.moveTo(padL,h-padB);c.lineTo(w-padR,h-padB);c.stroke();
    var ug=forward(kGuess),col=converged?'#2f6b2c':'#d97706';
    c.fillStyle=converged?'rgba(47,107,44,0.10)':'rgba(217,119,6,0.16)';
    c.beginPath();
    for(i=0;i<N;i++){var Xa=gx(i),Ya=gy(ug[i]);i?c.lineTo(Xa,Ya):c.moveTo(Xa,Ya);}
    for(i=N-1;i>=0;i--){c.lineTo(gx(i),gy(uobs[i]));}
    c.closePath();c.fill();
    c.fillStyle='#1b1d1f';for(i=0;i<N;i+=3){c.beginPath();c.arc(gx(i),gy(uobs[i]),2.0,0,6.2832);c.fill();}
    c.lineJoin='round';
    if(converged){c.strokeStyle='rgba(47,107,44,0.22)';c.lineWidth=8;trace(c,ug,gx,gy);c.stroke();}
    c.strokeStyle=col;c.lineWidth=2.8;trace(c,ug,gx,gy);c.stroke();
    c.font='11px ui-monospace,Menlo,monospace';c.textAlign='left';
    c.fillStyle='#1b1d1f';c.fillText('● data',padL+2,padT-4);
    c.fillStyle=col;c.fillText('— model  κ='+kGuess.toFixed(4),padL+56,padT-4);
    c.textAlign='right';
    if(converged){c.fillStyle='#2f6b2c';c.font='600 12px -apple-system,BlinkMacSystemFont,system-ui,sans-serif';c.fillText('✓ fitted',w-padR-2,padT-4);}
    else{c.fillStyle='#b0741f';c.fillText('shaded = mismatch',w-padR-2,padT-4);}
  }
  function setStatus(){
    var st=document.getElementById('fit-status'),J=lossOf(kGuess);
    document.getElementById('fit-kval').textContent=kGuess.toFixed(4);
    if(converged) st.innerHTML='✓ fitted — recovered κ = <b style="color:var(--green)">'+kGuess.toFixed(4)+
      '</b> (true κ = '+kTrue.toFixed(4)+') in '+step+' gradient steps · <b>New data</b> to try again';
    else st.innerHTML='mismatch J = <b style="color:var(--ink)">'+J.toExponential(2)+'</b> · step '+step+' · press <b>Solve</b> or drag κ';
  }
  function syncSlider(){document.getElementById('fit-slider').value=k2s(kGuess).toFixed(3);}
  function stop(){playing=false;if(anim){cancelAnimationFrame(anim);anim=null;}document.getElementById('fit-solve').textContent='Solve ▸';}
  function newData(){
    stop();
    kTrue=0.020+Math.random()*0.020;
    var base=forward(kTrue),mx=0,i;for(i=0;i<N;i++) if(base[i]>mx)mx=base[i];
    uobs=new Float64Array(N);for(i=0;i<N;i++) uobs[i]=base[i]+(Math.random()-0.5)*0.004*mx;
    kGuess=0.0035;step=0;converged=false;setStatus();syncSlider();draw();
  }
  function newtonPath(){
    var path=[kGuess],theta=Math.log(kGuess),hh=1e-3,it;
    for(it=0;it<12;it++){
      var Jm=lossOf(Math.exp(theta-hh)),J0=lossOf(Math.exp(theta)),Jp=lossOf(Math.exp(theta+hh));
      var g=(Jp-Jm)/(2*hh),Hs=(Jp-2*J0+Jm)/(hh*hh),stp=-g/Math.max(Math.abs(Hs),1e-12);
      var lr=1.0,nt,nJ;
      for(var bt=0;bt<24;bt++){nt=theta+lr*stp;nJ=lossOf(Math.exp(nt));if(nJ<=J0)break;lr*=0.5;}
      theta=nt;path.push(Math.exp(theta));
      if(Math.abs(g)<2e-6||nJ<1e-11)break;
    }
    return path;
  }
  var reduce=window.matchMedia&&window.matchMedia('(prefers-reduced-motion:reduce)').matches;
  function solve(){
    if(playing){stop();return;}
    if(converged){newData();}
    var path=newtonPath();
    if(reduce){kGuess=path[path.length-1];step=path.length-1;converged=true;setStatus();syncSlider();draw();return;}
    playing=true;document.getElementById('fit-solve').textContent='■ stop';
    var seg=0,TW=36,f=0;  // 36 frames/step ≈ 3× slower than before
    function ease(t){return t<0.5?2*t*t:1-Math.pow(-2*t+2,2)/2;}
    function frame(){
      if(!playing)return;
      if(seg>=path.length-1){kGuess=path[path.length-1];converged=true;step=path.length-1;stop();setStatus();syncSlider();draw();return;}
      var a=Math.log(path[seg]),b=Math.log(path[seg+1]),t=ease(f/TW);
      kGuess=Math.exp(a+(b-a)*t);step=seg;
      setStatus();syncSlider();draw();
      f++;if(f>TW){f=0;seg++;}
      anim=requestAnimationFrame(frame);
    }
    frame();
  }
  var _upd=false;
  function requestUpdate(){if(_upd)return;_upd=true;requestAnimationFrame(function(){_upd=false;setStatus();draw();});}
  document.getElementById('fit-slider').addEventListener('input',function(e){userTouched=true;stop();converged=false;kGuess=s2k(parseFloat(e.target.value));step=0;requestUpdate();});
  document.getElementById('fit-solve').addEventListener('click',function(){userTouched=true;solve();});
  document.getElementById('fit-new').addEventListener('click',function(){userTouched=true;newData();});
  var rt;window.addEventListener('resize',function(){clearTimeout(rt);rt=setTimeout(draw,120);});
  if(window.ResizeObserver){var ro=new ResizeObserver(function(){draw();});ro.observe(cv.parentNode);}
  var autoPlayed=false;
  function maybeAuto(){if(autoPlayed)return;autoPlayed=true;setTimeout(function(){if(!userTouched&&!playing&&!converged)solve();},900);}
  if(window.IntersectionObserver){var io=new IntersectionObserver(function(es){for(var k=0;k<es.length;k++){if(es[k].isIntersecting){maybeAuto();io.disconnect();break;}}},{threshold:0.35});io.observe(cv);}else maybeAuto();
  newData();
  setTimeout(draw,30);setTimeout(draw,250);setTimeout(draw,800);
})();
</script>

<p>Building the <strong>adjoint</strong> of a big atmospheric transport model — the thing you
need to turn satellite measurements into emission estimates — was a rite of
passage, talked about the way climbers talk about a summit. It could eat a year
or two of someone’s PhD. People wrote papers just about <em>how to write the
adjoint code</em> (<a href="https://doi.org/10.1145/293686.293695">Giering &amp; Kaminski, 1998</a>).
Whole model versions were named after it: the GEOS-Chem adjoint
(<a href="https://doi.org/10.5194/acp-7-2413-2007">Henze et al., 2007</a>), the TM5
four-dimensional variational system
(<a href="https://doi.org/10.5194/acp-8-6341-2008">Meirink et al., 2008</a>).</p>

<p>It ate the first six months of mine. I spent them learning to build adjoints by
hand, and being quietly floored that the recipe worked at all: apply a fixed set
of rules, mechanically, backwards through every line of your model, and out falls
the gradient of your cost with respect to every input. Not an approximation — the
<em>exact</em> gradient, to floating-point precision. A physical simulation could be made to hand
you its own exact sensitivities, if you were only disciplined enough about the
bookkeeping. And it did not end with the PhD: through my first postdoc I was
still in the thick of it — squeezing an order-of-magnitude speed-up out of the
TM5-4DVAR variational inversion system
(<a href="https://doi.org/10.5194/gmd-15-4555-2022">Pandey et al., 2022</a>), among other
variational-inversion work.</p>

<p>Then differentiable programming showed up and quietly deleted the hard part.</p>

<p>If your forward model is written in a framework like <a href="https://github.com/jax-ml/jax">JAX</a>,
the adjoint is <strong>already there</strong>. You do not derive it. You do not hand-code it.
You call <code class="language-plaintext highlighter-rouge">jax.grad</code>, and the framework walks backward through your model and
hands you the gradient. The thing that used to cost a PhD now costs one line.</p>

<p>Everything below is built from toy models small enough to run on a laptop — two of them you can play with
right here on the page.</p>

<h2 id="why-anyone-wants-an-adjoint-in-the-first-place">Why anyone wants an adjoint in the first place</h2>

<p>Start with the picture that pays for a lot of Earth-observing satellites.</p>

<p>A spectrometer in orbit — <a href="https://doi.org/10.1016/j.rse.2011.09.027">TROPOMI</a>,
GOSAT, OCO-2 — measures how much methane or CO₂ sits in a column of air. What we
actually <em>want</em> is not the concentration. It is the <strong>emissions</strong>: which well,
which wetland, which city, leaking how much
(<a href="https://doi.org/10.5194/acp-16-14371-2016">Jacob et al., 2016</a>).</p>

<p>Between the two sits a forward model:</p>

<div class="language-text highlighter-rouge"><div class="highlight"><pre class="highlight"><code>emissions  ──►  [ atmospheric transport + chemistry ]  ──►  concentrations
   (what we want)                                            (what we see)
</code></pre></div></div>

<p>The <strong>inverse problem</strong> is to run that arrow backwards: find the emissions that,
pushed through the model, best reproduce what the satellite saw. In practice you
never invert the arrow directly. You define a mismatch — a scalar cost that
measures how far the model is from the observations (plus a term keeping you near
a prior) — and you slide the emissions downhill until it is small. This is the
heart of variational inverse modelling, from global CO₂ budgets to satellite
methane — with some of the first global CO₂ flux inversions from GOSAT total-column retrievals
(<a href="https://doi.org/10.5194/acp-13-8695-2013">Basu et al., 2013</a>) sitting in between. The textbook, if you want one, is
<a href="https://doi.org/10.1017/CBO9780511535741">Enting (2002)</a>.</p>

<p>To slide downhill you need the <strong>gradient</strong>: how does the mismatch change if I
nudge each emission parameter? And here is the catch that makes or breaks the
whole enterprise. A real flux inversion does not have four unknowns. It has
emissions on a grid — thousands to millions of them. You need the derivative of
one number (the mismatch) with respect to <em>all</em> of them.</p>

<p>There are two ways to get it.</p>

<ul>
  <li><strong>Finite differences.</strong> Nudge one parameter, re-run the whole model, see how
the mismatch moved. Repeat for every parameter. For <code class="language-plaintext highlighter-rouge">P</code> unknowns that is about
<code class="language-plaintext highlighter-rouge">2P</code> full model runs. For a million-parameter inversion, that is a
non-starter — you would be re-running a chemistry-transport model a million
times just to take <em>one</em> step downhill.</li>
  <li><strong>The adjoint.</strong> Run the model forward once, then run a single backward pass
that propagates the sensitivity of the mismatch back through every operation,
accumulating the derivative with respect to <em>every</em> parameter along the way.
One forward pass, one backward pass, the entire gradient — almost regardless of
how many unknowns.</li>
</ul>

<p>That backward pass <strong>is</strong> the adjoint. If you have ever trained a neural network,
you already know it under a different name: backpropagation. Reverse-mode
automatic differentiation, the adjoint method, and backprop are the same idea
wearing three different lab coats (<a href="https://doi.org/10.1175/1520-0477(1997)078%3C2577:WIAAM%3E2.0.CO;2">Errico, 1997</a>
is still the friendliest one-page explanation for atmospheric scientists).</p>

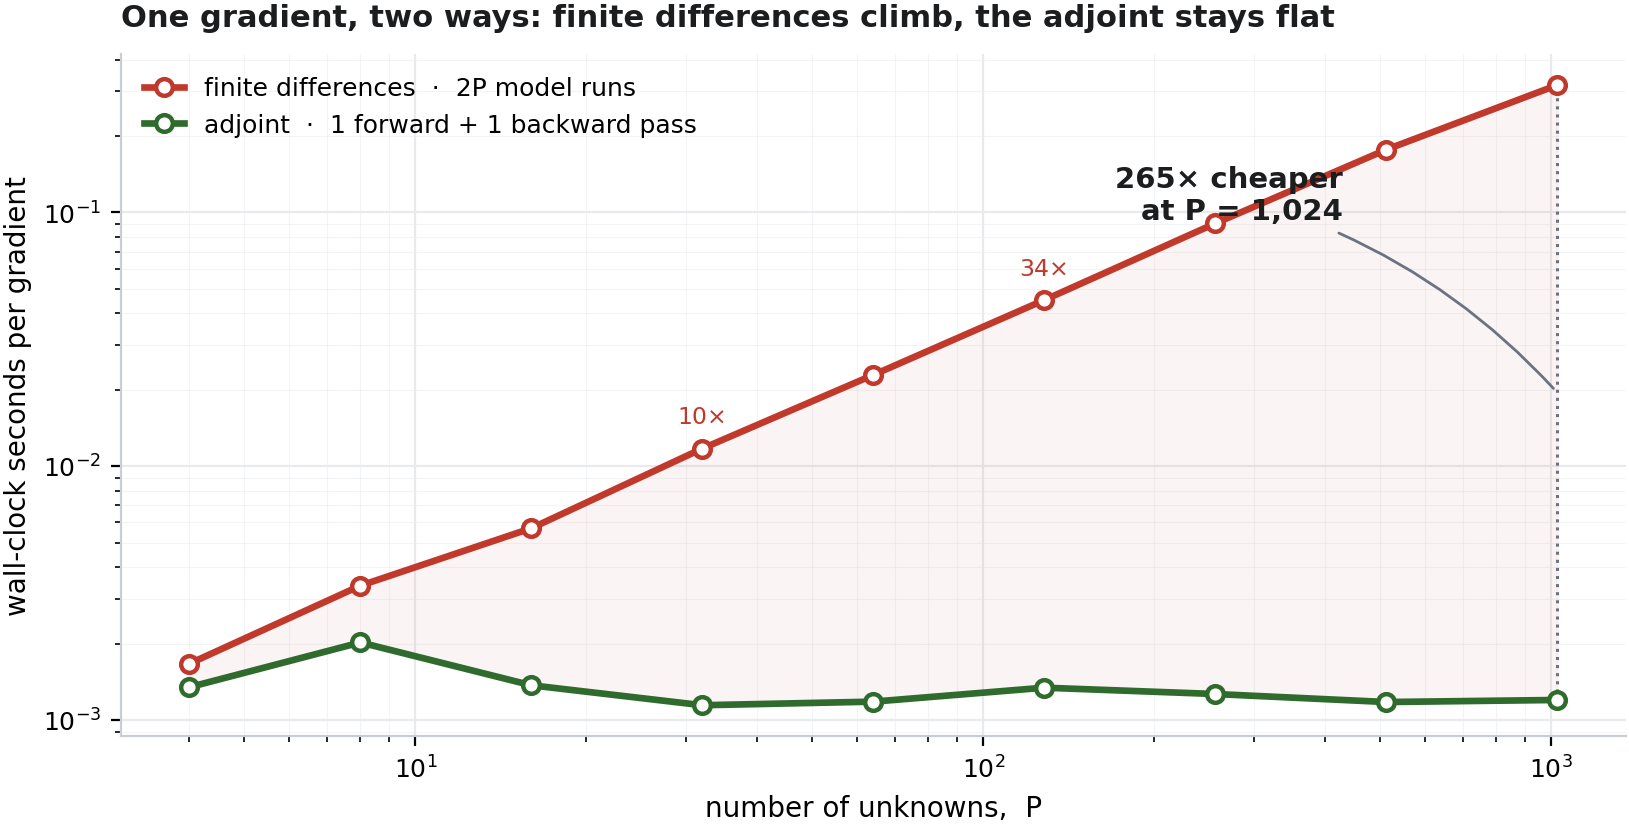
<p>Here is that trade-off, measured on a toy chemistry model — finite differences
climb with every unknown you add, while the adjoint stays almost flat:</p>

<p><img src="/assets/figures/jax_adjoint_gradient_scaling.png" alt="Finite-difference cost versus the adjoint gradient, as the number of unknowns grows" /></p>

<p><em>Finite differences re-run the whole model twice per unknown; the adjoint gets the
entire gradient in one backward pass, for roughly the same price no matter how
many unknowns there are. By 1,000 it is ~265× cheaper — and the gap keeps widening.</em></p>

<p>At a hundred thousand parameters, that gap is the difference between “runs
overnight” and “never finishes.”</p>

<h2 id="the-free-lunch-in-one-line">The free lunch, in one line</h2>

<p>Here is the part that still feels like cheating.</p>

<p>Take the simplest possible physical model — 1-D diffusion, heat (or a tracer)
spreading along a line:</p>

<div class="language-text highlighter-rouge"><div class="highlight"><pre class="highlight"><code>du/dt = kappa * d²u/dx²
</code></pre></div></div>

<p>with a single unknown, the diffusivity <code class="language-plaintext highlighter-rouge">kappa</code>. Write the time-stepper in JAX,
make some synthetic “observations” with a known <code class="language-plaintext highlighter-rouge">kappa_true</code>, and define the
mismatch:</p>

<div class="language-python highlighter-rouge"><div class="highlight"><pre class="highlight"><code><span class="kn">import</span> <span class="nn">jax</span><span class="p">,</span> <span class="n">jax</span><span class="p">.</span><span class="n">numpy</span> <span class="k">as</span> <span class="n">jnp</span>

<span class="k">def</span> <span class="nf">forward</span><span class="p">(</span><span class="n">kappa</span><span class="p">):</span>
    <span class="n">u</span> <span class="o">=</span> <span class="n">u0</span>
    <span class="k">for</span> <span class="n">_</span> <span class="ow">in</span> <span class="nb">range</span><span class="p">(</span><span class="n">n_steps</span><span class="p">):</span>                 <span class="c1"># explicit diffusion step
</span>        <span class="n">u</span> <span class="o">=</span> <span class="n">u</span> <span class="o">+</span> <span class="n">kappa</span> <span class="o">*</span> <span class="n">dt</span><span class="o">/</span><span class="n">dx</span><span class="o">**</span><span class="mi">2</span> <span class="o">*</span> <span class="p">(</span><span class="n">jnp</span><span class="p">.</span><span class="n">roll</span><span class="p">(</span><span class="n">u</span><span class="p">,</span><span class="mi">1</span><span class="p">)</span> <span class="o">-</span> <span class="mi">2</span><span class="o">*</span><span class="n">u</span> <span class="o">+</span> <span class="n">jnp</span><span class="p">.</span><span class="n">roll</span><span class="p">(</span><span class="n">u</span><span class="p">,</span><span class="o">-</span><span class="mi">1</span><span class="p">))</span>
    <span class="k">return</span> <span class="n">u</span>

<span class="k">def</span> <span class="nf">loss</span><span class="p">(</span><span class="n">kappa</span><span class="p">):</span>
    <span class="k">return</span> <span class="n">jnp</span><span class="p">.</span><span class="n">mean</span><span class="p">((</span><span class="n">forward</span><span class="p">(</span><span class="n">kappa</span><span class="p">)</span> <span class="o">-</span> <span class="n">u_obs</span><span class="p">)</span><span class="o">**</span><span class="mi">2</span><span class="p">)</span>

<span class="n">grad_loss</span> <span class="o">=</span> <span class="n">jax</span><span class="p">.</span><span class="n">grad</span><span class="p">(</span><span class="n">loss</span><span class="p">)</span>      <span class="c1"># &lt;-- this is the discrete adjoint. that's it.
</span></code></pre></div></div>

<p>(One vocabulary note before anything else: the <code class="language-plaintext highlighter-rouge">loss</code> in that code is exactly
what the inverse-modelling literature calls the <strong>cost function</strong> — the single
number you minimise. Same object, two dialects; I’ll use the words
interchangeably.)</p>

<p><code class="language-plaintext highlighter-rouge">jax.grad(loss)</code> is the adjoint of your time-stepping model. Not an
approximation of it — the exact derivative of the numerical code you wrote,
assembled by differentiating every operation in reverse, at least for the parts
of the model JAX can trace (more on where that breaks below). Conceptually:</p>

<div class="language-text highlighter-rouge"><div class="highlight"><pre class="highlight"><code>forward:    kappa ──► diffusion steps ──► final state ──► loss
backward:   d(loss) ──► d(final state) ──► back through every time step ──► d(loss)/dkappa
</code></pre></div></div>

<p>No adjoint model was written. Feed that gradient to an optimizer and the inverse
problem just… solves:</p>

<div class="language-text highlighter-rouge"><div class="highlight"><pre class="highlight"><code>true kappa:            0.035000
initial guess:         0.006000
recovered kappa:       0.035513      (1.5% off, from a 6× wrong start)
</code></pre></div></div>

<p>Twenty years ago, that would have been a week of careful calculus and debugging.
Now it is a function call.</p>

<h2 id="a-cartoon-of-a-real-methane-inversion">A cartoon of a real methane inversion</h2>

<p>One unknown is a party trick. Let’s make it look a little more like the day job.</p>

<p>I built a <strong>two-box atmospheric chemistry model</strong>: a “northern” box and a
“southern” box that exchange air, each carrying three tracers — <strong>CH₄, CO, and
NOₓ</strong>. The chemistry is deliberately nonlinear: CH₄ and CO are destroyed by the
hydroxyl radical OH, and OH itself depends on how much CH₄, CO, and NOₓ are
present. (That coupling — methane’s lifetime depending on the very air it sits in — is a
real headache for explaining methane’s ups and downs;
<a href="https://doi.org/10.1038/nature05132">Bousquet et al., 2006</a>.)</p>

<p>Then I hid the answer. I picked four “true” emission scale factors, generated
synthetic CH₄ and CO observations over five years, and asked the inversion to
recover the emissions it was never told:</p>

<div class="language-text highlighter-rouge"><div class="highlight"><pre class="highlight"><code>control        true      recovered
CH4 north      1.3000     1.2999
CO  north      0.7000     0.7000
CH4 south      0.7500     0.7501
CO  south      1.4000     1.4000
</code></pre></div></div>

<p>Four decimal places — in this clean, noise-free synthetic case — from one scalar
mismatch and its adjoint gradient, through a nonlinear coupled-chemistry model.
Same one line, <code class="language-plaintext highlighter-rouge">jax.value_and_grad(loss)</code>, doing the work. Recovering several
coupled tracers at once from column measurements is exactly the shape of a real
satellite inversion: the very first paper of my PhD was a joint CH₄/CO₂ column
inversion of much the same shape
(<a href="https://doi.org/10.5194/acp-15-8615-2015">Pandey et al., 2015</a>). It is the same
machinery behind today’s operational methane and CO₂ flux estimates
(<a href="https://doi.org/10.5194/acp-8-6341-2008">Meirink et al., 2008</a>;
<a href="https://doi.org/10.1029/2005JD006390">Chevallier et al., 2005</a>).</p>

<h2 id="okay-you-have-the-gradient-now-what-do-you-do-with-it">Okay, you have the gradient. Now what do you do with it?</h2>

<p>A gradient tells you which way is downhill. It does not tell you how big a step to
take, and this is where a lot of grad-student hours quietly disappear.</p>

<p>The plainest choice is a first-order optimizer — Adam, the workhorse from deep
learning — which only ever looks at the gradient. It works, but it can be slow,
wandering down long narrow valleys taking cautious steps.</p>

<p>The alternative is to use <strong>curvature</strong> — second-derivative information about how
the landscape bends. Two classic moves from the inverse-problems world:</p>

<ul>
  <li><strong>Gauss-Newton / Levenberg-Marquardt</strong> approximates the curvature from the
Jacobian of the residuals (<code class="language-plaintext highlighter-rouge">JᵀJ</code>). It is the default for smooth
least-squares problems for a reason.</li>
  <li><strong>Full Newton</strong> uses the exact Hessian — which JAX will hand you for a small
problem, <code class="language-plaintext highlighter-rouge">jax.hessian(loss)</code> (at real scale you never form it; you use
Hessian-vector products instead).</li>
</ul>

<p>Get a feel for the difference on the classic test valley below: gradient descent
only sees the slope and zig-zags for thousands of steps; curvature cuts across in
a dozen. Drag the start point and race them.</p>

<section class="iw-card" id="iw-race">
  <p class="iw-eyebrow">Interactive · optimizer race</p>
  <p class="iw-title">Slope vs. curvature</p>
  <p class="iw-note">Both optimizers start together and chase the same minimum down a curved valley.
  One follows the slope; the other uses curvature. Press <em>Race</em> — or click the map to move the start.</p>
  <div class="iw-panel"><canvas class="iw" id="r-canvas" style="cursor:crosshair;"></canvas></div>
  <div class="iw-controls">
    <button class="iw primary" id="r-race">Race ▸</button>
    <button class="iw" id="r-reset">Reset</button>
    <span class="iw-stat" style="margin-left:auto;">
      <span style="color:var(--steel); font-weight:700;">● gradient descent</span>
      <b id="r-gd" style="color:var(--steel);">0</b>
      &nbsp;&nbsp;<span style="color:var(--green); font-weight:700;">● Gauss–Newton</span>
      <b id="r-gn" style="color:var(--green);">0</b>
    </span>
  </div>
  <p class="iw-stat" id="r-status" style="margin-top:10px; color:var(--muted);">Ready. Both start at the amber dot.</p>
  <p class="iw-caption">Watch the steel path: gradient descent only knows which way is <em>locally</em> downhill,
  so it first dives to the nearest point on the valley floor — down-left, <em>away</em> from the minimum — and
  then has to crawl thousands of steps back along the floor. Gauss–Newton (green) also knows how the valley
  <em>bends</em>, so it ignores that plunge and cuts almost straight to the answer in about a dozen steps.
  Same destination — curvature is what pays for the shortcut.</p>
</section>
<script>
(function(){
  var A=1,B=40,MINX=1,MINY=1;
  var XLO=-1.7,XHI=1.7,YLO=-0.7,YHI=2.3;
  function f(x,y){return (A-x)*(A-x)+B*(y-x*x)*(y-x*x);}
  function grad(x,y){return [-2*(A-x)-4*B*x*(y-x*x), 2*B*(y-x*x)];}
  var cv=document.getElementById('r-canvas'),bg=null,bgW=0,bgH=0,dpr=Math.min(window.devicePixelRatio||1,2);
  var start=[-0.6,2.0];  // deliberately off the valley floor: steepest descent dives to the
                         // nearest floor point (down-left, AWAY from the minimum) before crawling back
  function fit(){var w=cv.clientWidth||520,h=Math.round(w*0.60);cv.width=Math.round(w*dpr);cv.height=Math.round(h*dpr);cv.style.height=h+'px';return[w,h];}
  var W,H;
  function px(x){return (x-XLO)/(XHI-XLO)*W;}
  function py(y){return (1-(y-YLO)/(YHI-YLO))*H;}
  function buildBG(){
    var d=cv.getContext('2d');d.setTransform(1,0,0,1,0,0);
    bg=d.createImageData(cv.width,cv.height);var data=bg.data;
    for(var j=0;j<cv.height;j++){for(var i=0;i<cv.width;i++){
      var x=XLO+(i/cv.width)*(XHI-XLO), y=YLO+(1-j/cv.height)*(YHI-YLO);
      var v=Math.log10(f(x,y)+0.02), t=Math.max(0,Math.min(1,(v+1.7)/3.4));
      // darker = lower cost (the valley reads as a basin you look down into); light = high ground
      var r=Math.round(44+(238-44)*t), g=Math.round(62+(241-62)*t), b=Math.round(88+(245-88)*t);
      var o=(j*cv.width+i)*4;data[o]=r;data[o+1]=g;data[o+2]=b;data[o+3]=255;
    }}
    bgW=cv.width;bgH=cv.height;
  }
  var gd,gdSteps,gdPath,gdDone,ln,lam,gnSteps,gnPath,gnDone,anim=null,racing=false,frames=0;
  var reduce=window.matchMedia&&window.matchMedia('(prefers-reduced-motion:reduce)').matches;
  function resetState(){
    gd=start.slice();gdSteps=0;gdPath=[start.slice()];gdDone=false;
    ln=start.slice();lam=1e-2;gnSteps=0;gnPath=[start.slice()];gnDone=false;
    document.getElementById('r-gd').textContent='0';
    document.getElementById('r-gn').textContent='0';
    document.getElementById('r-status').textContent='Ready. Both start at the amber dot.';
    draw();
  }
  function gdAdvance(n){var lr=0.003;for(var k=0;k<n&&!gdDone;k++){var g=grad(gd[0],gd[1]);gd[0]-=lr*g[0];gd[1]-=lr*g[1];gdSteps++;
    if(gdSteps<=50||gdSteps%12===0)gdPath.push(gd.slice());  // sample finely early to show the plunge
    if(f(gd[0],gd[1])<1e-3||gdSteps>=4000){gdDone=true;gdPath.push(gd.slice());}}}
  function gnAdvance(){ // one accepted LM step
    if(gnDone)return;
    var x=ln[0],y=ln[1],sb=Math.sqrt(B);
    var r0=(A-x),r1=sb*(y-x*x),j00=-1,j10=-2*sb*x,j11=sb;
    var Aa=j00*j00+j10*j10,Bb=j10*j11,Cc=j11*j11,gx=j00*r0+j10*r1,gy=j11*r1;
    for(var tries=0;tries<40;tries++){
      var A2=Aa+lam,C2=Cc+lam,det=A2*C2-Bb*Bb;
      var dx=(-gx*C2+gy*Bb)/det,dy=(gx*Bb-gy*A2)/det;
      if(f(x+dx,y+dy)<f(x,y)){ln[0]=x+dx;ln[1]=y+dy;lam=Math.max(lam*0.4,1e-9);gnSteps++;gnPath.push(ln.slice());break;}
      else lam*=3;
    }
    if(f(ln[0],ln[1])<1e-8)gnDone=true;
  }
  function path(d,pts,color,wdt){d.strokeStyle=color;d.lineWidth=wdt;d.beginPath();for(var i=0;i<pts.length;i++){var X=px(pts[i][0]),Y=py(pts[i][1]);i?d.lineTo(X,Y):d.moveTo(X,Y);}d.stroke();}
  function dot(d,p,color,rad){d.fillStyle=color;d.strokeStyle='#fff';d.lineWidth=2;d.beginPath();d.arc(px(p[0]),py(p[1]),rad,0,6.2832);d.fill();d.stroke();}
  function draw(){
    var d=cv.getContext('2d');d.setTransform(1,0,0,1,0,0);
    if(!bg||bgW!==cv.width||bgH!==cv.height)buildBG();
    d.putImageData(bg,0,0);
    d.setTransform(dpr,0,0,dpr,0,0);
    // white halos so both paths stay visible over the dark valley
    path(d,gdPath,'rgba(255,255,255,.85)',4.4);
    path(d,gnPath,'rgba(255,255,255,.9)',4.8);
    path(d,gdPath,'#5b83b0',2.4);
    path(d,gnPath,'#4e9a4a',2.6);
    dot(d,gd,'#5b83b0',4);
    dot(d,ln,'#4e9a4a',4);
    dot(d,start,'#f59e0b',4.5);
    // minimum marker (the basin floor) + label, drawn on top so it is always visible
    var mX=px(MINX),mY=py(MINY);
    d.fillStyle='#4e9a4a';d.strokeStyle='#fff';d.lineWidth=2;
    d.beginPath();d.arc(mX,mY,6,0,6.2832);d.fill();d.stroke();
    d.font='600 11px -apple-system,BlinkMacSystemFont,system-ui,sans-serif';d.textAlign='left';
    d.strokeStyle='rgba(15,17,21,.75)';d.lineWidth=3;d.strokeText('minimum',mX+10,mY+4);
    d.fillStyle='#fff';d.fillText('minimum',mX+10,mY+4);
    // legend
    d.fillStyle='rgba(15,17,21,.6)';d.fillRect(6,H-22,224,16);
    d.fillStyle='#eef1f5';d.font='10px ui-monospace,Menlo,monospace';d.textAlign='left';
    d.fillText("bird's-eye view · darker = lower cost",11,H-10);
  }
  function loop(){
    if(!racing)return;
    frames++;
    gdAdvance(gdSteps<40?2:26); if(!gnDone && frames%3===0) gnAdvance();  // slow during the dive, fast on the crawl
    document.getElementById('r-gd').textContent=gdSteps.toLocaleString('en-US');
    document.getElementById('r-gn').textContent=gnSteps;
    draw();
    if(gdDone&&gnDone){racing=false;finish();return;}
    anim=requestAnimationFrame(loop);
  }
  function finish(){
    document.getElementById('r-race').textContent='Race ▸';
    var gnf=gnSteps, gdf=gdSteps;
    document.getElementById('r-status').innerHTML=
      '<span style="color:var(--green)">Gauss–Newton reached the minimum in '+gnf+' steps.</span> '+
      '<span style="color:var(--steel)">Gradient descent needed '+gdf.toLocaleString('en-US')+
      (gdf>=4000?'+ and was still crawling':'')+'.</span>';
  }
  function race(){
    if(racing){racing=false;if(anim)cancelAnimationFrame(anim);document.getElementById('r-race').textContent='Race ▸';return;}
    if(gdDone&&gnDone)resetState();
    if(reduce){ // instant
      while(!gdDone)gdAdvance(200); var guard=0; while(!gnDone&&guard<60){gnAdvance();guard++;}
      document.getElementById('r-gd').textContent=gdSteps.toLocaleString('en-US');
      document.getElementById('r-gn').textContent=gnSteps; draw(); finish(); return;
    }
    racing=true;frames=0;document.getElementById('r-race').textContent='■ stop';
    document.getElementById('r-status').textContent='Racing…';
    loop();
  }
  document.getElementById('r-race').addEventListener('click',race);
  document.getElementById('r-reset').addEventListener('click',function(){racing=false;if(anim)cancelAnimationFrame(anim);document.getElementById('r-race').textContent='Race ▸';resetState();});
  cv.addEventListener('click',function(e){
    if(racing)return;
    var rect=cv.getBoundingClientRect();
    var x=XLO+((e.clientX-rect.left)/rect.width)*(XHI-XLO);
    var y=YLO+(1-(e.clientY-rect.top)/rect.height)*(YHI-YLO);
    x=Math.max(XLO+0.05,Math.min(XHI-0.05,x));y=Math.max(YLO+0.05,Math.min(YHI-0.05,y));
    start=[x,y];resetState();
  });
  var rt;window.addEventListener('resize',function(){clearTimeout(rt);rt=setTimeout(function(){var s=fit();W=s[0];H=s[1];bg=null;draw();},140);});
  var s=fit();W=s[0];H=s[1];resetState();
  setTimeout(function(){var s2=fit();W=s2[0];H=s2[1];bg=null;draw();},30);
})();
</script>

<p>The same pattern holds on our actual two-box chemistry model: with a nonlinear
penalty added, Adam grinds through about 180 iterations to settle, while
Gauss-Newton — using curvature from the residual Jacobian — gets there in 7.</p>

<p>And here is the part that should make a carbon-cycle
person sit up: <strong>the curvature you compute to go fast is the same curvature you
need for error bars.</strong> For Gaussian errors and a linear approximation near the
solution, the posterior covariance — your uncertainty on the recovered
emissions — is</p>

<div class="language-text highlighter-rouge"><div class="highlight"><pre class="highlight"><code>posterior covariance  ≈  ( Jᵀ R⁻¹ J  +  B⁻¹ )⁻¹
</code></pre></div></div>

<p>that same <code class="language-plaintext highlighter-rouge">JᵀJ</code>-shaped object, built from the prior (<code class="language-plaintext highlighter-rouge">B</code>) and observation (<code class="language-plaintext highlighter-rouge">R</code>)
error covariances. In our field a flux estimate without an uncertainty is not a
result — it is a rumour. So the method that converges fastest is <em>also</em> the one
that tells you how much to trust the answer. You rarely get to have both; here
you do.</p>

<p><strong>An aside for the inversion crowd.</strong> That Gauss-Newton Hessian <code class="language-plaintext highlighter-rouge">A = JᵀR⁻¹J + B⁻¹</code> is doing
double duty: its inverse is the posterior covariance, and that same inverse
maps the gradient straight to the answer in a single Newton step,
<code class="language-plaintext highlighter-rouge">x* = x₀ − A⁻¹g</code> — from a starting guess <code class="language-plaintext highlighter-rouge">x₀</code> to the optimum <code class="language-plaintext highlighter-rouge">x*</code>, with <code class="language-plaintext highlighter-rouge">g</code> the
gradient (a quadratic cost has constant curvature, so one step lands it). So why
do operational CH₄/CO₂ inversions grind through hundreds of conjugate-gradient
iterations instead of solving in one shot? Because that gradient is only
<code class="language-plaintext highlighter-rouge">g = A(x − x*)</code> — the Hessian times the error, not the error itself — and undoing
that needs <code class="language-plaintext highlighter-rouge">A⁻¹</code>. JAX gives you <code class="language-plaintext highlighter-rouge">A</code>’s action on a vector for free by composing <code class="language-plaintext highlighter-rouge">jax.jvp</code> and
<code class="language-plaintext highlighter-rouge">jax.vjp</code> (the <em>full</em> Hessian <code class="language-plaintext highlighter-rouge">jax.hessian</code> returns would match <code class="language-plaintext highlighter-rouge">A</code> only in this
linear-Gaussian limit). <em>Forming</em> <code class="language-plaintext highlighter-rouge">A</code> explicitly still costs about one pass per
unknown, and <em>inverting</em> it costs <code class="language-plaintext highlighter-rouge">P³</code> operations — fine for a handful of
controls, hopeless for a million-cell flux field. So at
scale you never build <code class="language-plaintext highlighter-rouge">A</code>; you use its action on vectors (matrix-free
Hessian–vector products) and let conjugate gradient approximate the solution <code class="language-plaintext highlighter-rouge">A⁻¹g</code> one Krylov
direction at a time.</p>

<p>So which do you actually reach for, for smooth least-squares problems like these?</p>

<ul>
  <li><strong>Default: Gauss-Newton / Levenberg-Marquardt</strong> with autodiff Jacobians — fast,
and the curvature it computes doubles as your posterior uncertainty — a full
covariance when the system is small enough to form, low-rank estimates at scale.</li>
  <li><strong>At scale: matrix-free Gauss-Newton</strong> — never form the giant Jacobian; use its
action on vectors via forward-mode (<code class="language-plaintext highlighter-rouge">Jv</code>) and reverse-mode (<code class="language-plaintext highlighter-rouge">Jᵀv</code>) products.</li>
  <li><strong>Fallback: adjoint Adam / L-BFGS</strong> when Gauss-Newton is hard to stabilise.</li>
  <li><strong>Finite differences:</strong> keep them only to check your fancy derivatives are right.</li>
</ul>

<h2 id="the-trap-nobody-warns-you-about-switches">The trap nobody warns you about: switches</h2>

<p>Automatic differentiation feels like magic until it silently lies to you, and
the usual culprit is a <strong>discontinuity</strong>.</p>

<p>Atmospheric models are full of them: rain / no-rain switches in wet deposition,
threshold chemistry, hard <code class="language-plaintext highlighter-rouge">min</code>/<code class="language-plaintext highlighter-rouge">max</code> limiters, “if concentration &gt; X then…”
branches. At the switch itself, the mathematical derivative doesn’t exist, and
your framework will happily hand you the slope of whichever branch it happened to
take — a number that looks fine and points the wrong way. Higher-order
derivatives near a switch are even more treacherous.</p>

<p>The fixes are part of the craft, and worth internalising early:</p>

<ul>
  <li>replace a hard <code class="language-plaintext highlighter-rouge">max(0, x)</code> with a smooth <code class="language-plaintext highlighter-rouge">softplus</code>;</li>
  <li>replace a hard threshold with a sigmoid ramp;</li>
  <li>interpolate lookup tables instead of snapping to bins;</li>
  <li>and for genuinely discrete decisions, step outside gradient-based methods
entirely.</li>
</ul>

<p>None of this is JAX-specific — a hand-written adjoint has exactly the same
disease. Differentiable programming doesn’t rescue you from bad math; it just
makes the <em>good</em> math free.</p>

<h2 id="why-this-is-a-bigger-deal-than-a-toy">Why this is a bigger deal than a toy</h2>

<p>The toys are toys. But the shape of the result is not.</p>

<p>For thirty years, the two great cultures of Earth-system modelling — the
physics-first modellers who wrote transport-and-chemistry codes, and the
statistics-first inverse modellers who wanted to fit them to data — were
separated by a moat, and the moat was the adjoint. Getting derivatives through a
physical model was so expensive that it defined what was and wasn’t possible.</p>

<p>Differentiable programming drains the moat. When the gradient of any model you
can write is free, the boundary between “simulation” and “optimisation” dissolves. The catch hides in <em>you can write</em>: your model has to live in a
differentiable framework to begin with, and porting a legacy Fortran
chemistry-transport model into JAX is its own multi-year undertaking — arguably
where the hard part now lives.</p>

<p>It is the same current carrying the ML weather models — GraphCast
(<a href="https://doi.org/10.1126/science.adi2336">Lam et al., 2023</a>) and its cousins are
neural networks, differentiable by construction — and it flows straight back into classical inverse
problems, and into the hybrid physics-ML models now being built in between, which
need clean gradients through the physics to train at all.</p>

<p>The adjoint stopped being the summit. It became the base camp. And the interesting
work — the science — moved up a level, to what you point all that cheap gradient
<em>at</em>.</p>

<h2 id="nerdy-note">Nerdy note</h2>

<ul>
  <li><strong>The models.</strong> A 1-D periodic diffusion solver and a nonlinear two-box
CH₄/CO/NOₓ chemistry-transport toy, both written in JAX and stepped with
<code class="language-plaintext highlighter-rouge">jax.lax.scan</code>. Deliberately small and non-dimensionalised — they demonstrate
algorithmic structure, not production chemistry.</li>
  <li><strong>The adjoint.</strong> <code class="language-plaintext highlighter-rouge">jax.grad</code> / <code class="language-plaintext highlighter-rouge">jax.value_and_grad</code> give reverse-mode gradients
(<code class="language-plaintext highlighter-rouge">Jᵀ</code>-vector products via <code class="language-plaintext highlighter-rouge">jax.vjp</code>); <code class="language-plaintext highlighter-rouge">jax.jvp</code> gives forward-mode tangent-linear
products (<code class="language-plaintext highlighter-rouge">Jv</code>); <code class="language-plaintext highlighter-rouge">jax.hessian</code> gives the exact Hessian for small problems. The
matrix-free Gauss-Newton route composes <code class="language-plaintext highlighter-rouge">jvp</code> then <code class="language-plaintext highlighter-rouge">vjp</code> to apply <code class="language-plaintext highlighter-rouge">JᵀJ</code> without
ever forming it.</li>
  <li><strong>The memory catch.</strong> Reverse mode has to keep (or recompute) the whole forward
trajectory to run backward, so memory grows with time-steps × state size — the
real wall for long model runs, tamed by checkpointing (Griewank’s revolve).</li>
  <li><strong>The scaling numbers.</strong> Finite-difference vs adjoint gradient on the two-box
model: 1.2× at 4 parameters, 33.7× at 128, and 264.8× at 1,024 — growing
∝ <code class="language-plaintext highlighter-rouge">P</code>, because central differences cost <code class="language-plaintext highlighter-rouge">2P</code> model runs while the adjoint costs
one backward pass. Convergence on the nonlinear penalty: Adam 180 iterations,
Gauss-Newton 7, full Newton 9, all to the identical objective.</li>
  <li><strong>The hardware.</strong> Everything ran on a MacBook — no supercomputer — including on
the laptop’s own GPU via <code class="language-plaintext highlighter-rouge">jax-metal</code>, which peaked at ~1.96× over CPU near 2¹⁸
grid cells (CPU won for both very small and very large grids).</li>
  <li><strong>Same code, any hardware.</strong> The forward model and its adjoint are one JAX
source; XLA JIT-compiles them to CPU, GPU, or TPU with no changes. Exact
derivatives <em>and</em> accelerator speed from one codebase is the combination that
makes large inversions practical.</li>
  <li><strong>Not a JAX-only story.</strong> The same free-adjoint idea runs through Julia’s SciML
ecosystem — where adjoint sensitivity analysis differentiates through ODE/PDE
solvers directly — as well as PyTorch and TensorFlow. JAX is one dialect of a
broader shift to differentiable programming.</li>
</ul>

<p><img src="/assets/figures/jax_adjoint_method_matrix.png" alt="Decision matrix comparing inversion algorithms across cost, scaling, reliability, and uncertainty" /></p>

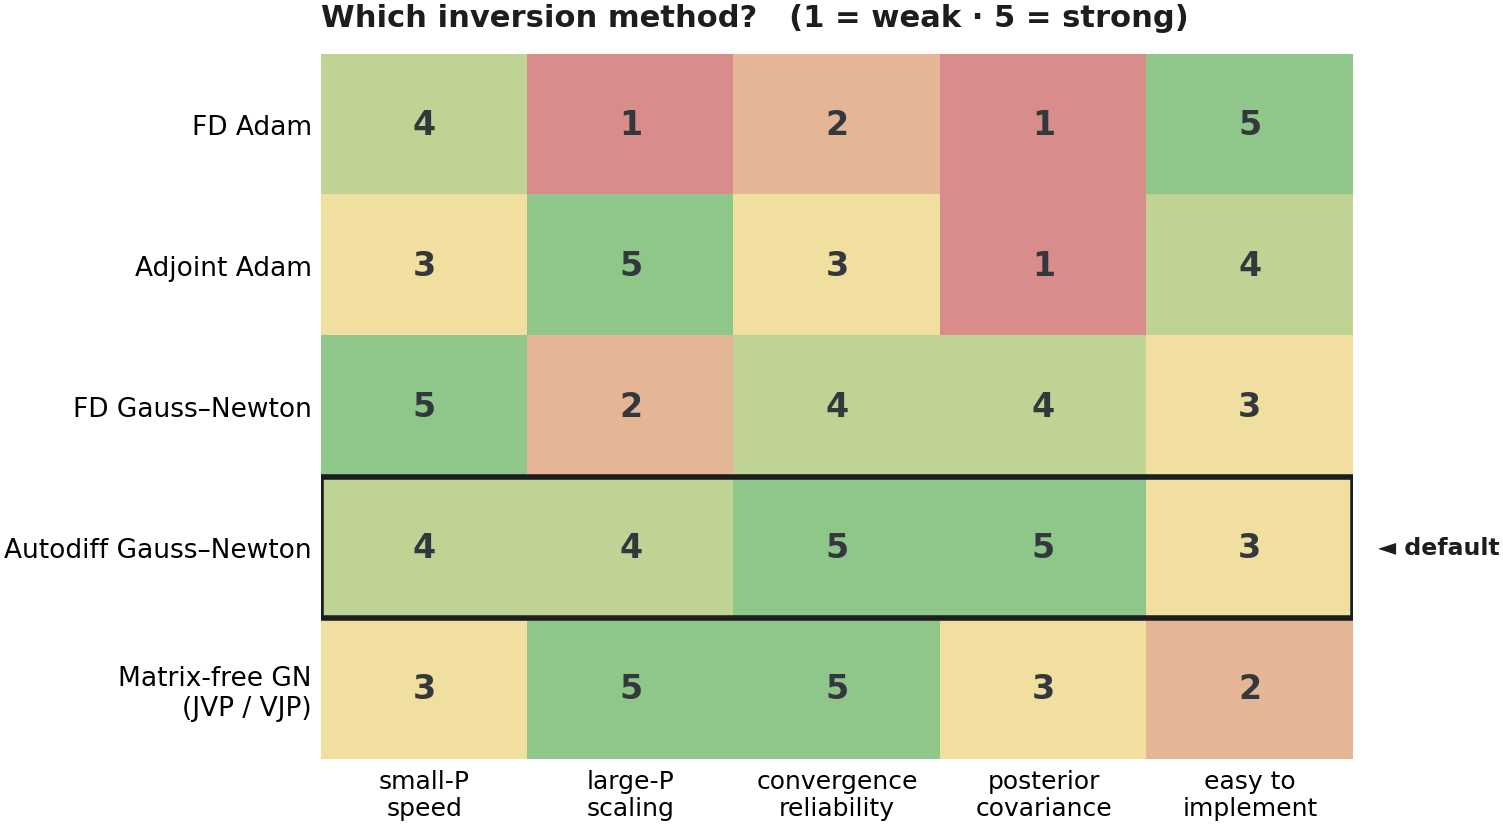
<p><em>The full decision matrix behind the recommendations above — five algorithm families
scored on small-P speed, large-P scaling, convergence reliability, posterior
usefulness, and implementation effort.</em></p>

<h2 id="takeaway">Takeaway</h2>

<p>The adjoint used to be the hardest, most artisanal part of quantitative
Earth science — a thing you built once, carefully, and then guarded. Differentiable
programming turned it into infrastructure: invisible, reliable, one line long.</p>

<p>That doesn’t make the science easier. Deciding <em>what</em> to invert, which
observations to trust, how to regularise, where the model is lying to you — all of
that is exactly as hard as it ever was. But we no longer pay a tax of two years
and a thousand lines of hand-written derivative code just to get in the door. The
gradient is free now. Go spend it on something interesting.</p>

<hr />

<p><em>The JAX experiments and figures in this post were built in a scratch coding
session with an AI assistant. More about the author at
<a href="https://sudshu.github.io/">sudshu.github.io</a>.</em></p>

<p><em>The views and opinions expressed in this article are those of the author alone
and do not reflect those of the JPL, NASA and CALTECH.</em></p>

<h2 id="further-reading">Further reading</h2>

<p><strong>Adjoints and variational data assimilation</strong></p>
<ul>
  <li>Errico (1997), <em>What is an adjoint model?</em> Bull. Amer. Meteor. Soc. — <a href="https://doi.org/10.1175/1520-0477(1997)078%3C2577:WIAAM%3E2.0.CO;2">doi</a></li>
  <li>Talagrand &amp; Courtier (1987), <em>Variational assimilation of meteorological observations with the adjoint vorticity equation. I: Theory.</em> QJRMS — <a href="https://doi.org/10.1002/qj.49711347812">doi</a></li>
  <li>Giering &amp; Kaminski (1998), <em>Recipes for adjoint code construction.</em> ACM TOMS — <a href="https://doi.org/10.1145/293686.293695">doi</a></li>
</ul>

<p><strong>Inverse modelling of the carbon cycle and methane</strong></p>
<ul>
  <li>Enting (2002), <em>Inverse Problems in Atmospheric Constituent Transport.</em> Cambridge Univ. Press — <a href="https://doi.org/10.1017/CBO9780511535741">doi</a></li>
  <li>Gurney et al. (2002), <em>Towards robust regional estimates of CO₂ sources and sinks using atmospheric transport models.</em> Nature — <a href="https://doi.org/10.1038/415626a">doi</a></li>
  <li>Rödenbeck et al. (2003), <em>CO₂ flux history 1982–2001 inferred from atmospheric data using a global inversion of atmospheric transport.</em> ACP — <a href="https://doi.org/10.5194/acp-3-1919-2003">doi</a></li>
  <li>Chevallier et al. (2005), <em>Inferring CO₂ sources and sinks from satellite observations: method and application to TOVS data.</em> JGR — <a href="https://doi.org/10.1029/2005JD006390">doi</a></li>
  <li>Basu et al. (2013), <em>Global CO₂ fluxes estimated from GOSAT retrievals of total column CO₂</em> — among the first global CO₂ flux inversions from GOSAT retrievals. ACP — <a href="https://doi.org/10.5194/acp-13-8695-2013">doi</a></li>
  <li>Henze et al. (2007), <em>Development of the adjoint of GEOS-Chem.</em> ACP — <a href="https://doi.org/10.5194/acp-7-2413-2007">doi</a></li>
  <li>Meirink et al. (2008), <em>Four-dimensional variational data assimilation for inverse modelling of atmospheric methane emissions: method and comparison with synthesis inversion.</em> ACP — <a href="https://doi.org/10.5194/acp-8-6341-2008">doi</a></li>
  <li>Bergamaschi et al. (2009), <em>Inverse modeling of global and regional CH₄ emissions using SCIAMACHY satellite retrievals.</em> JGR — <a href="https://doi.org/10.1029/2009JD012287">doi</a></li>
  <li>Bousquet et al. (2006), <em>Contribution of anthropogenic and natural sources to atmospheric methane variability.</em> Nature — <a href="https://doi.org/10.1038/nature05132">doi</a></li>
</ul>

<p><strong>Remote sensing and satellite methane</strong></p>
<ul>
  <li>Veefkind et al. (2012), <em>TROPOMI on the ESA Sentinel-5 Precursor: a GMES mission for global observations of the atmospheric composition for climate, air quality and ozone layer applications.</em> Remote Sens. Environ. — <a href="https://doi.org/10.1016/j.rse.2011.09.027">doi</a></li>
  <li>Jacob et al. (2016), <em>Satellite observations of atmospheric methane and their value for quantifying methane emissions.</em> ACP — <a href="https://doi.org/10.5194/acp-16-14371-2016">doi</a></li>
</ul>

<p><strong>My own, in this lineage</strong></p>
<ul>
  <li>Pandey et al. (2015), <em>On the use of satellite-derived CH₄:CO₂ columns in a joint inversion of CH₄ and CO₂ fluxes</em> — the first paper of my PhD. ACP — <a href="https://doi.org/10.5194/acp-15-8615-2015">doi</a></li>
  <li>Pandey et al. (2019), <em>Satellite observations reveal extreme methane leakage from a natural gas well blowout.</em> PNAS — <a href="https://doi.org/10.1073/pnas.1908712116">doi</a></li>
  <li>Pandey et al. (2022), <em>Order of magnitude wall time improvement of variational methane inversions by physical parallelization: a demonstration using TM5-4DVAR.</em> GMD — <a href="https://doi.org/10.5194/gmd-15-4555-2022">doi</a></li>
</ul>

<p><strong>Differentiable ML weather models</strong></p>
<ul>
  <li>Lam et al. (2023), <em>Learning skillful medium-range global weather forecasting (GraphCast).</em> Science — <a href="https://doi.org/10.1126/science.adi2336">doi</a></li>
</ul>]]></content><author><name>Sudhanshu Pandey</name></author><category term="inverse-modeling" /><category term="carbon-cycle" /><category term="remote-sensing" /><category term="data-assimilation" /><category term="JAX" /><category term="adjoint" /><summary type="html"><![CDATA[In carbon-cycle science the adjoint is the engine behind large-scale variational emission estimates — and it used to take years to build by hand. Then differentiable programming quietly deleted the hard part. A grad-student-level tour, with toy code, real satellites, and a laptop GPU.]]></summary><media:thumbnail xmlns:media="http://search.yahoo.com/mrss/" url="https://sudshu.github.io/assets/figures/jax_adjoint_og_card.png" /><media:content medium="image" url="https://sudshu.github.io/assets/figures/jax_adjoint_og_card.png" xmlns:media="http://search.yahoo.com/mrss/" /></entry><entry><title type="html">Yosemite, a waterfall, a neural network, and the data threshold where ML overtakes physics</title><link href="https://sudshu.github.io/2026/06/08/yosemite-waterfall-ml-vs-4dvar.html" rel="alternate" type="text/html" title="Yosemite, a waterfall, a neural network, and the data threshold where ML overtakes physics" /><published>2026-06-08T00:00:00+00:00</published><updated>2026-06-08T00:00:00+00:00</updated><id>https://sudshu.github.io/2026/06/08/yosemite-waterfall-ml-vs-4dvar</id><content type="html" xml:base="https://sudshu.github.io/2026/06/08/yosemite-waterfall-ml-vs-4dvar.html"><![CDATA[<p><img src="/assets/figures/hero_yosemite_valley.jpg" alt="Yosemite Valley with Bridalveil Falls" /></p>

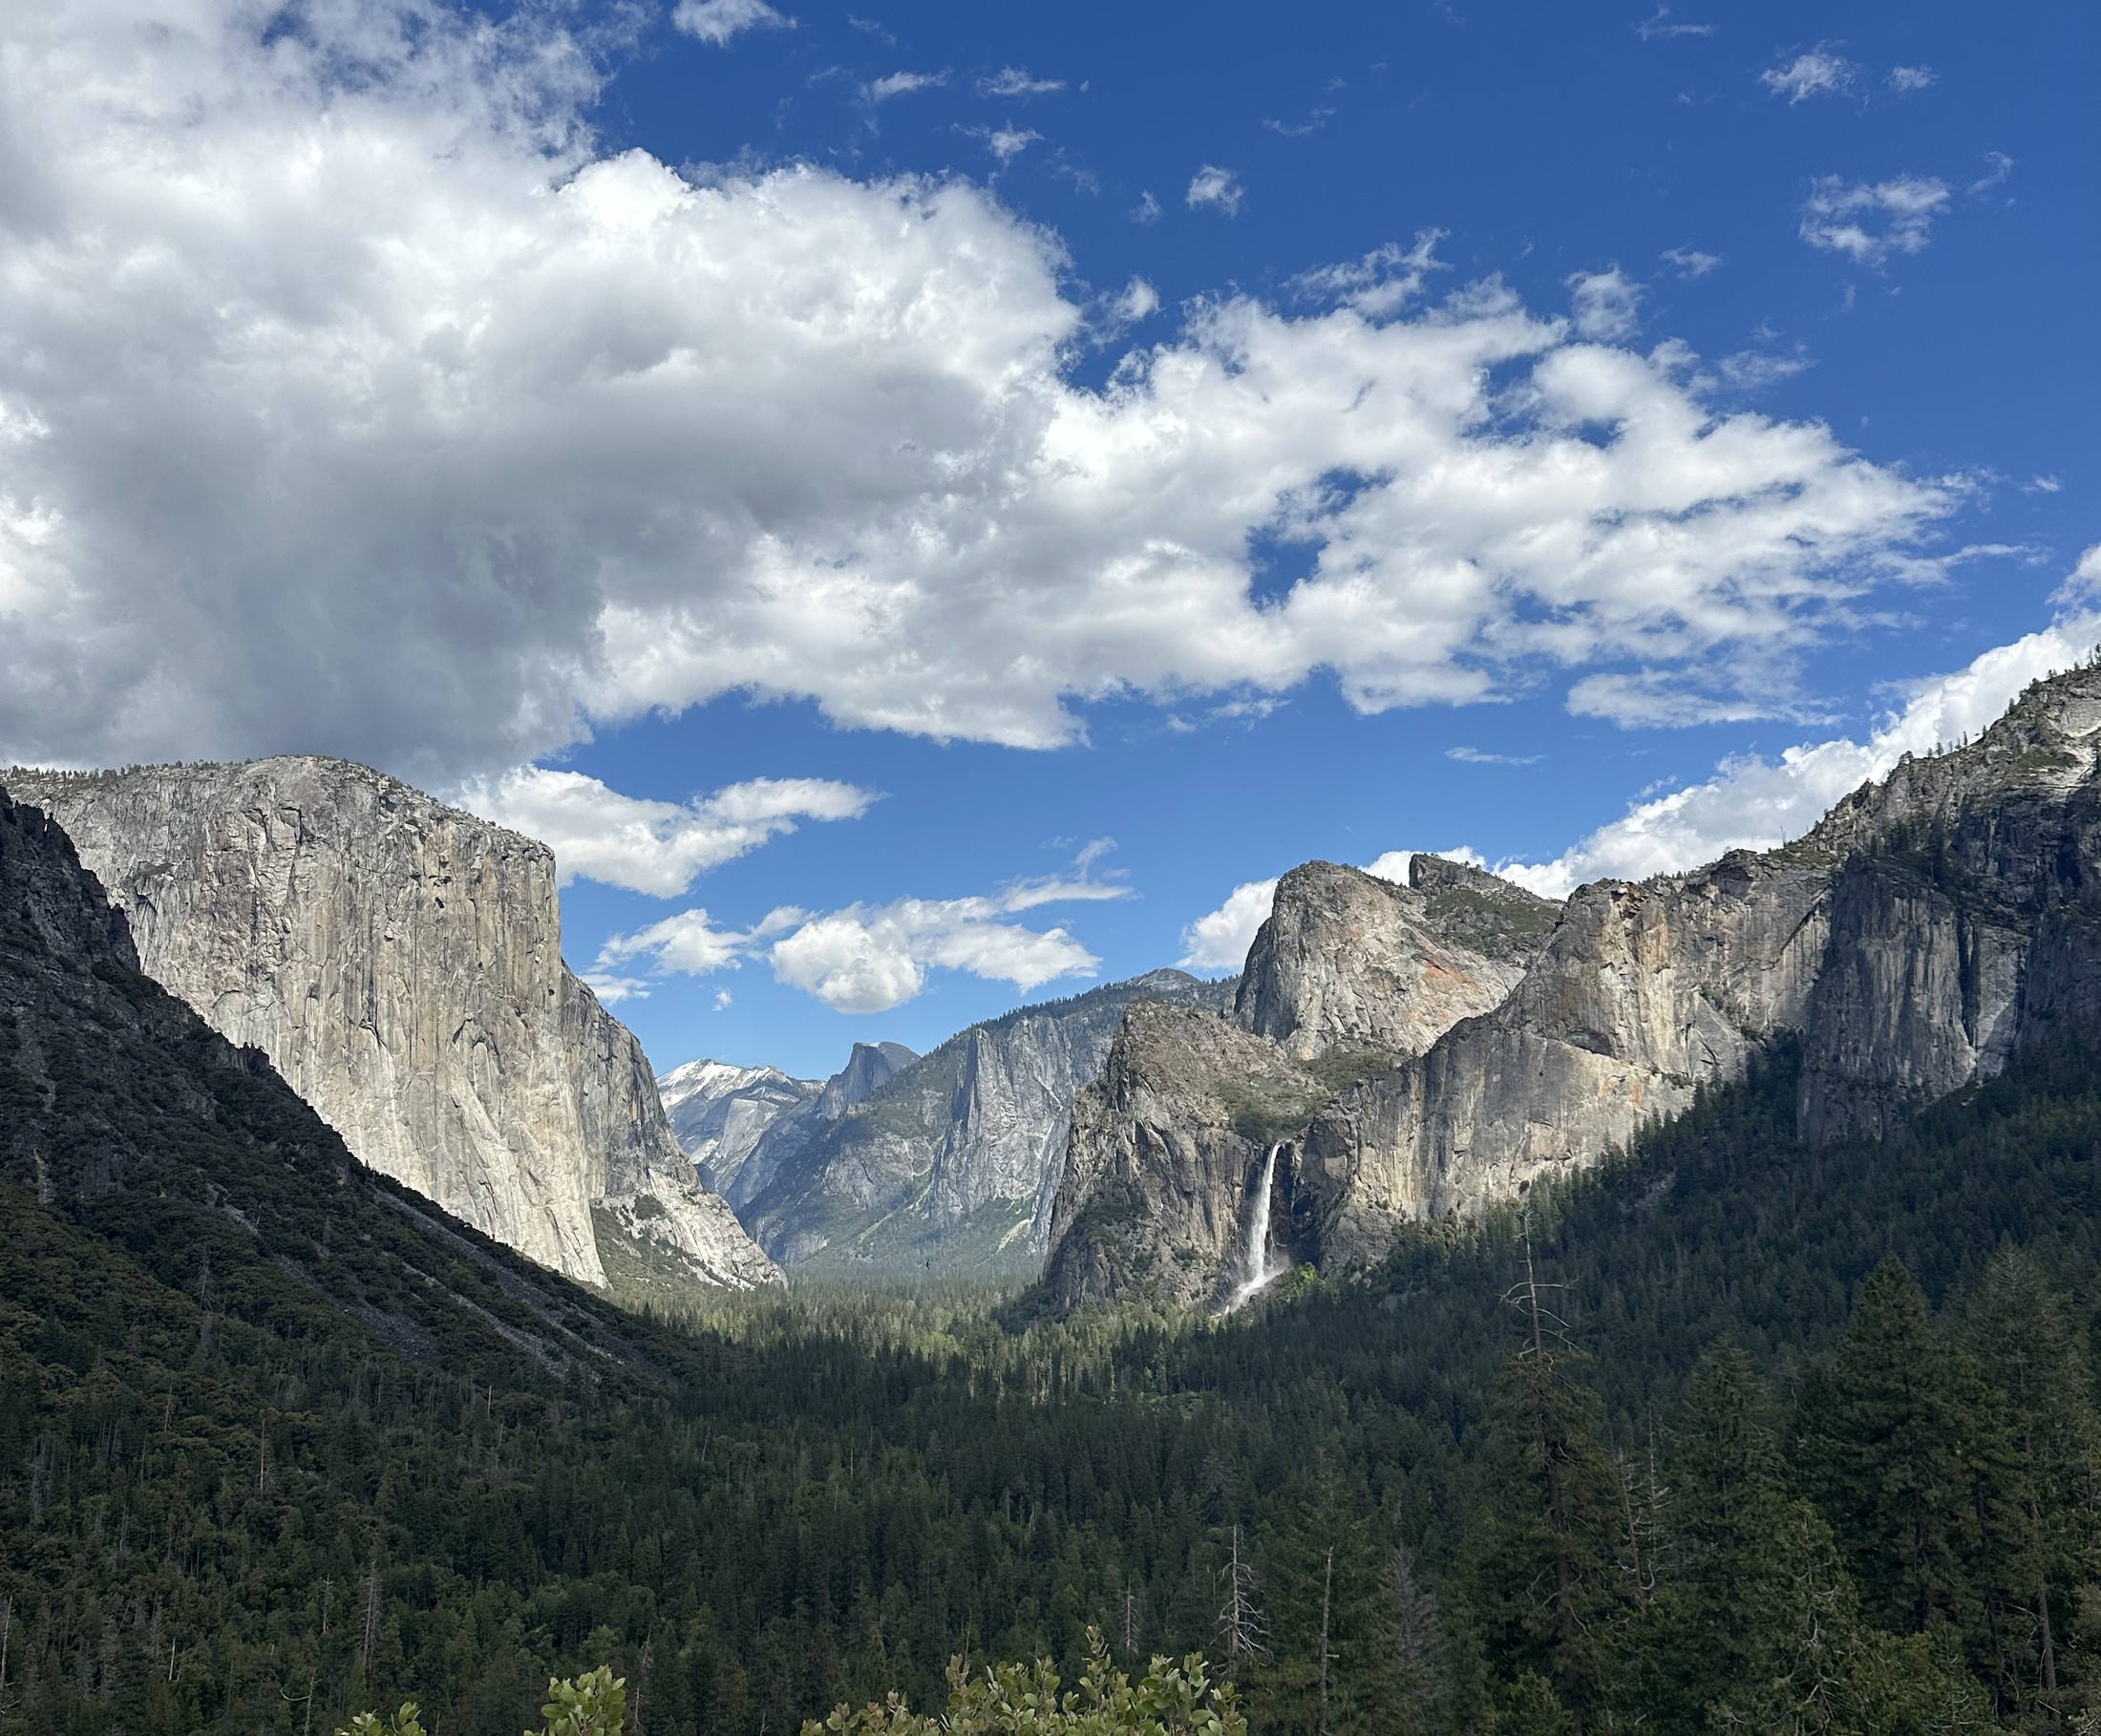
<p><em>Yosemite Valley from the Wawona Tunnel View. The waterfall analysed in
this post is Bridalveil Falls.</em></p>

<p>I went to Yosemite recently. It might be the most beautiful place I have
ever visited. Standing in front of Bridalveil Falls, watching the water
fall cleanly for a moment and then dissolve into spray, I noticed
something: from far away, the waterfall looked almost steady. Up close, it
was chaos — mist drifting sideways, white streaks appearing and
disappearing, the same waterfall every second but never the same frame
twice. I pulled out my phone and shot a 60-second clip of it to take home.</p>

<p>That made me wonder something concrete: <strong>when would a neural network be
able to predict the next few moments of this waterfall better than a
simple physics-based model?</strong> The real video itself is the ground truth.
Both methods are scored on how closely their predicted frames match what
actually happens next.</p>

<p>It is a tiny version of a bigger question now playing out in weather and
climate science. Modern ML weather models can compete with physics-based
forecasts, but they do so after learning from enormous archives of past
weather. My waterfall experiment asks the same question at toy scale:
<strong>how much data does ML need before it overtakes physics?</strong></p>

<p>A few weekends of GPU time later, I have an answer. It is not “AI overtakes
physics” once and for all — it is a <strong>crossover</strong>. Physics wins when data
are scarce. ML wins once it has watched enough examples.</p>

<p><img src="/assets/figures/figure2_waterfall_video.gif" alt="Bridalveil Falls with the analysis region boxed" /></p>

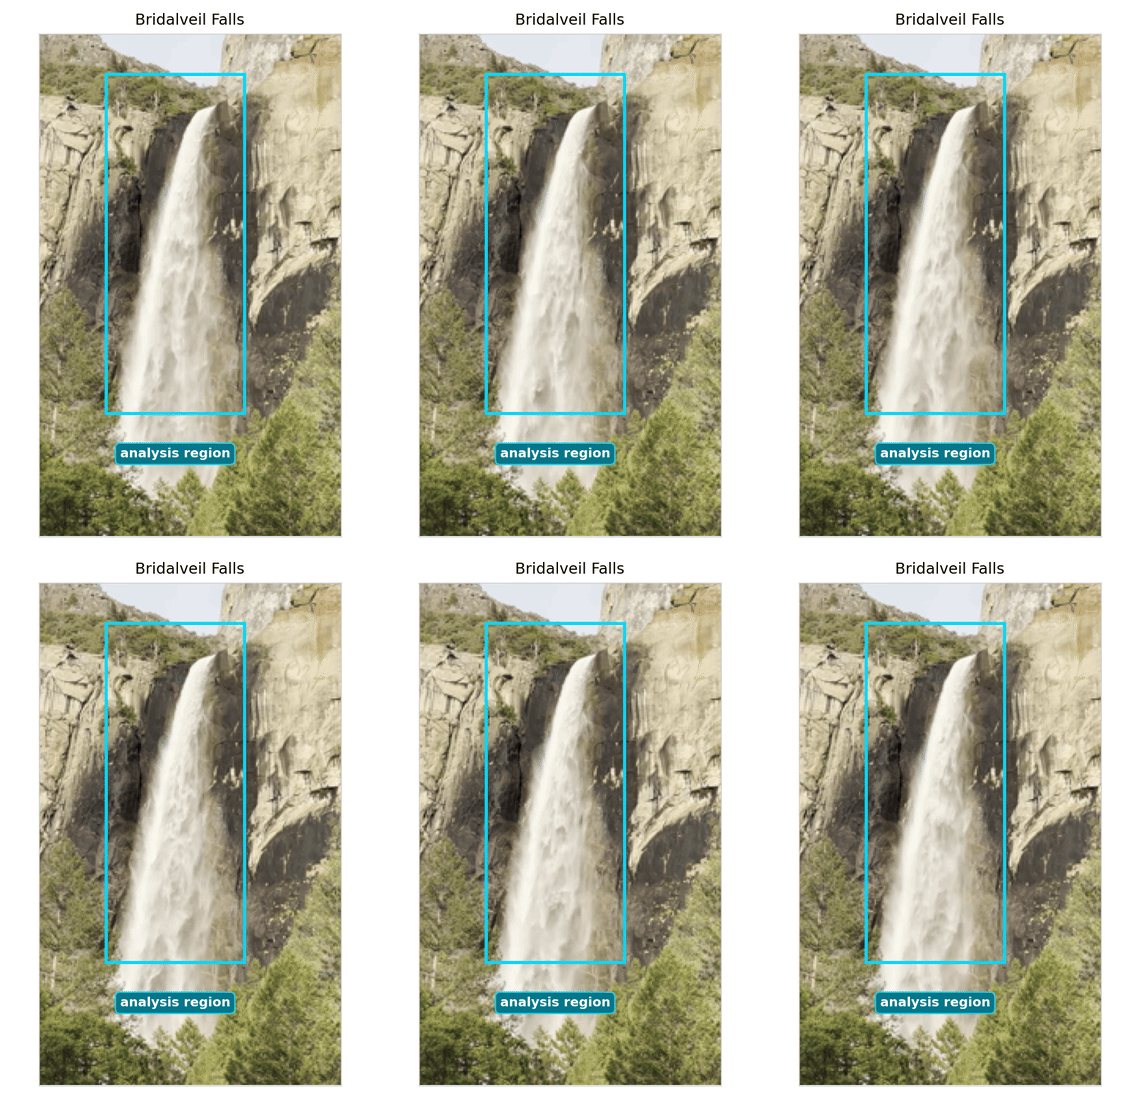
<p><em>The clip. We focus on the boxed region — the cliff face, the falling
column, and the mist envelope — and leave the static rocks and sky out of
the comparison.</em></p>

<h2 id="the-prediction-game">The prediction game</h2>

<p>I gave both models the same game. Each model saw the last five video
frames (the clip is 30 frames per second) and had to predict the next
one. Then I made it harder: each prediction was fed back as input and the
model had to predict the <em>next</em> one — and so on, for sixty steps. Two
seconds of water that hasn’t happened yet.</p>

<p>The <strong>physics baseline</strong> estimated smooth motion in the image — an
optical-flow field — and carried the waterfall forward by that motion. It
starts with a useful built-in assumption: most of the water is moving
continuously, mostly downward, under gravity.</p>

<p>The <strong>neural network</strong> learned from examples. It watched part of the clip
during training, learned how the waterfall tends to change from one frame
to the next, and then tried the same two-second rollout on a strictly
held-out segment of the clip that it had never seen before.</p>

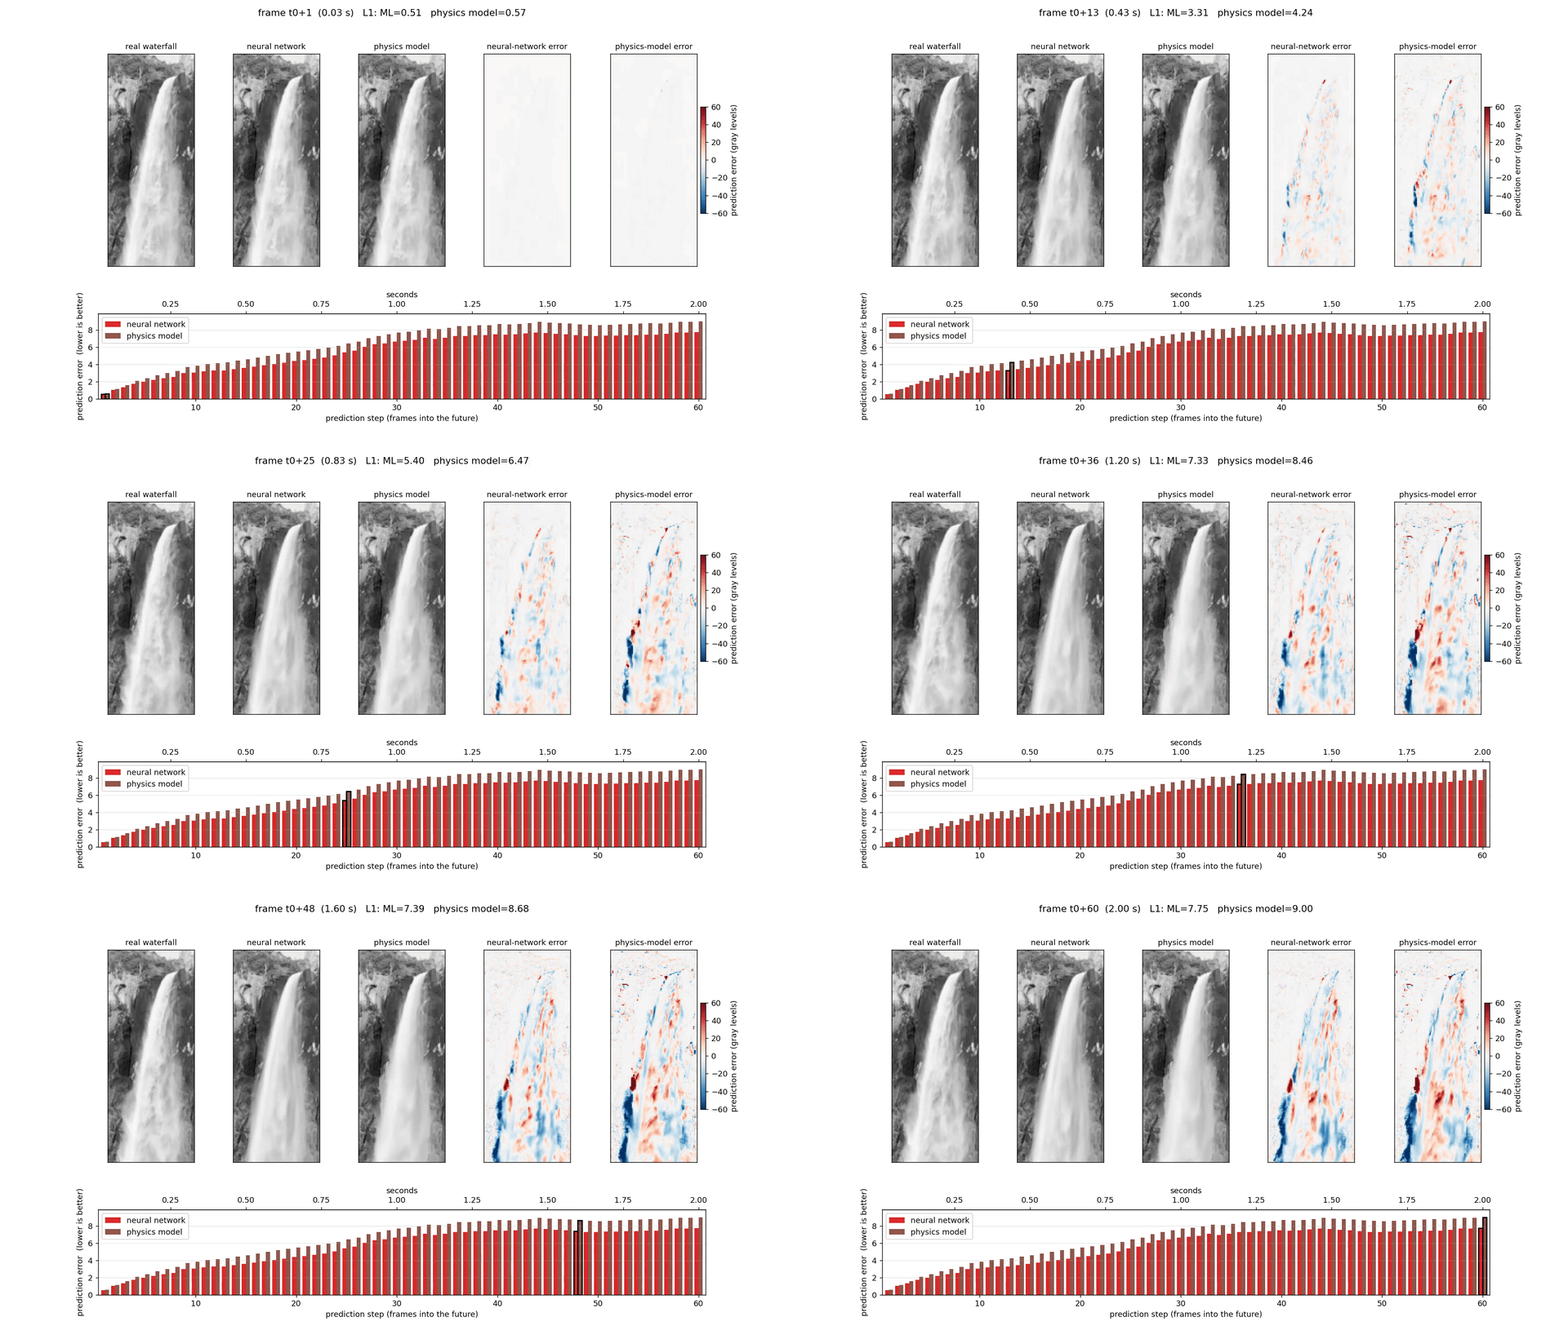
<p>Here is what a 2-second forecast looks like, side by side. Real waterfall
on the left, the two predictions in the middle, and per-frame prediction
error in red and brown bars at the bottom.</p>

<p><img src="/assets/figures/compare_with_bars_hires_slow3x.gif" alt="ML vs 4D-Var rollout animation" /></p>

<p>Both methods blur as the rollout gets longer, which is expected: the
turbulent details quickly become unpredictable. But with the full training
clip, the neural network stays closer to the real waterfall than the
physics baseline.</p>

<p>So the AI wins? Not quite.</p>

<h2 id="the-real-result-how-much-data-does-ml-need">The real result: how much data does ML need?</h2>

<p>The interesting experiment wasn’t <em>“can ML win?”</em> It was <strong>“how much video
does ML need before it wins?”</strong></p>

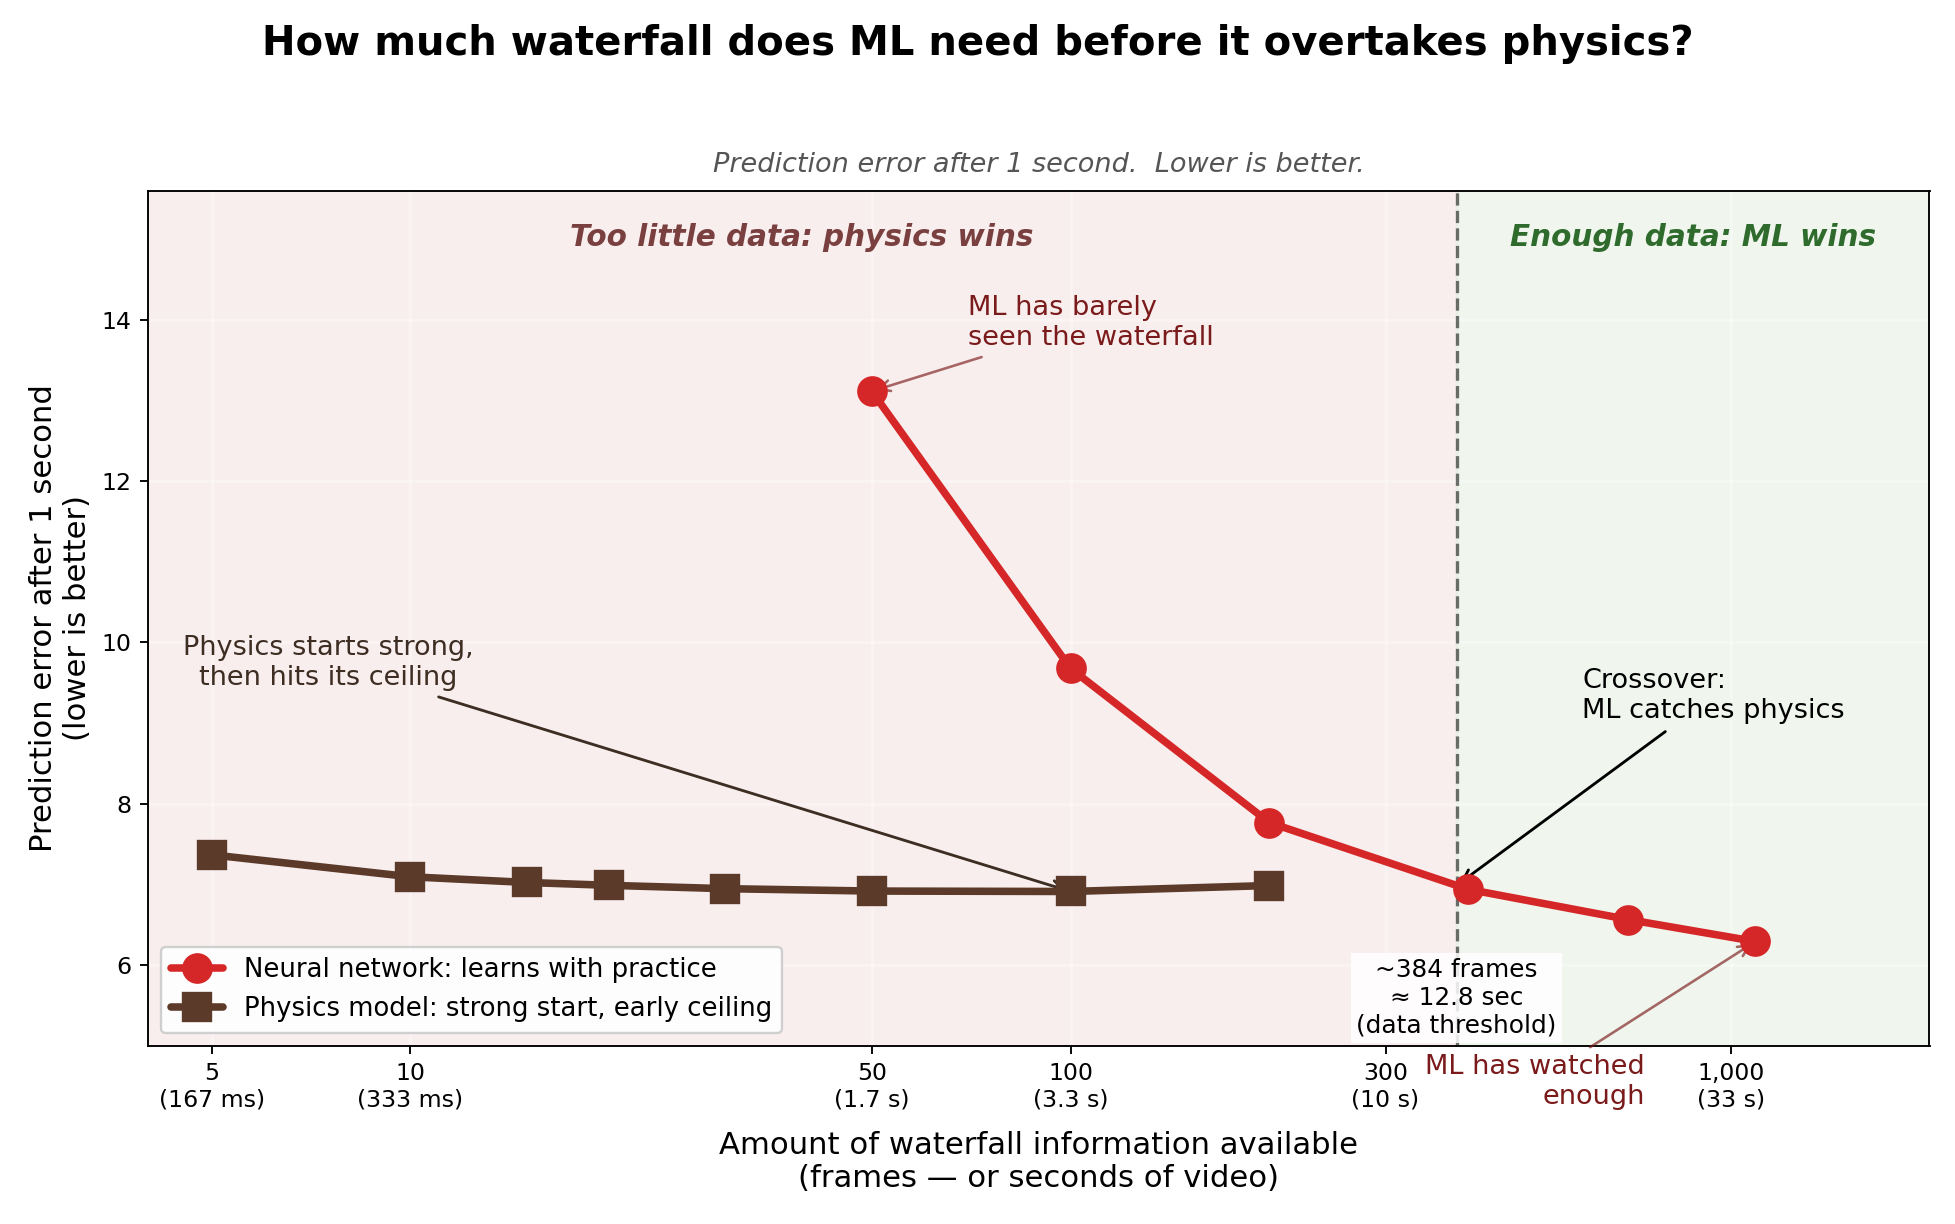
<p>I retrained the neural network on different fractions of the clip — 50
frames, 100, 200, 400, 700, or all 1,090 — and re-ran the same forecast
against the same physics model. This is what came out:</p>

<p><img src="/assets/figures/headline_playful.png" alt="How much waterfall does ML need before it overtakes physics" /></p>

<p><em>The data threshold. With 50 frames the neural network is much worse than
the physics model. Around a few hundred frames — roughly 10 seconds of
video — it catches up. With the whole clip, it wins.</em></p>

<p>This is the main result. <strong>The physics model has a ceiling; the neural
network has a slope.</strong> The physics model starts strong because it already
knows a useful rule: water moves smoothly and downward. But it cannot
learn the messy residual structure of spray, flicker, and turbulence. The
neural network starts with no such built-in knowledge — but with enough
examples it learns the visual habits that smooth advection misses.</p>

<h2 id="why-the-crossover-matters">Why the crossover matters</h2>

<p>The Yosemite waterfall is obviously not the atmosphere. But the <em>shape</em>
of the result is familiar. Physics-based models encode strong assumptions
and work immediately. ML models need data, but once enough data exist,
they can learn structure that the simpler physics baseline misses.</p>

<p>That is why the training archive matters. ML weather models like
<a href="https://www.nature.com/articles/s41586-023-06185-3">Pangu-Weather</a>,
<a href="https://www.science.org/doi/10.1126/science.adi2336">GraphCast</a>,
<a href="https://arxiv.org/abs/2202.11214">FourCastNet</a>, and
<a href="https://arxiv.org/abs/2405.13063">Aurora</a> can compete with operational
forecasts — but only after training on decades of
<a href="https://www.ecmwf.int/en/forecasts/dataset/ecmwf-reanalysis-v5">ERA5 reanalysis</a>.
That archive is their version of the <em>300 frames of waterfall</em>. When an
ML weather model overtakes a physics-based forecast, the useful question is
not only “which model won?” — it is also: <strong>how much data did the ML
model need before it crossed over?</strong></p>

<h2 id="caveats">Caveats</h2>

<ul>
  <li>This is one clip of one waterfall. The exact crossover point could
shift for a longer video, a different waterfall, or a different
turbulent system.</li>
  <li>The physics model is intentionally simple — smooth optical-flow
advection, not a full fluid-dynamics simulation. A full CFD model would
be a different (and much more expensive) comparison.</li>
  <li>The neural network is also intentionally small and trained only on this
clip. A larger pretrained video model would likely shift the curve, but
the slope-versus-ceiling story would remain the point.</li>
</ul>

<h2 id="nerdy-note">Nerdy note</h2>

<ul>
  <li><strong>ML model.</strong> A 1.7-M-parameter <a href="https://arxiv.org/abs/2103.14030">Swin-UNet</a>
trained autoregressively with a short rollout curriculum
(1 → 2 → 4 steps). It predicts a residual update rather than raw pixels:
<code class="language-plaintext highlighter-rouge">f̂(t+1) = clamp( f(t) + Δ , 0, 1 )</code>. This helps because most pixels are
nearly unchanged between adjacent frames; the useful signal is
concentrated where the water and mist are actually moving.</li>
  <li><strong>Physics baseline.</strong> A 4D-Var-style variational fit of a smooth velocity
field to the past 5 frames, plus persistent-velocity advection of the
most recent frame forward. This is “physics” in the limited sense of
<em>smooth image advection</em>, not a full Navier-Stokes simulation. In
bias-variance terms the physics baseline is high-bias (stable but
restricted); the neural network is high-variance (data-hungry but
improves with examples).</li>
  <li><strong>Quantitative result.</strong> At a 1-second forecast lead time, the
NWP-optimised physics baseline reaches L1 ≈ 7.32 (0–255 grayscale); the
full-data ML model reaches L1 ≈ 6.29, about 14 % better. The crossover
is best read as somewhere between 200 and 400 training frames, not a
precise universal number.</li>
  <li><strong>Code, video, and figures.</strong>
<a href="https://github.com/sudshu/yosemite-waterfall-ml">github.com/sudshu/yosemite-waterfall-ml</a>.</li>
</ul>

<h2 id="takeaway">Takeaway</h2>

<p>The lesson is not that ML magically overtakes physics. The lesson is that the
winner depends on the data regime. With too little waterfall, the physics
baseline wins because it starts with a useful prior. With enough waterfall,
the neural network wins because it learns the messy structure that the
simple physics model cannot represent.</p>

<p>Different systems, same question: <strong>where is the data threshold at which
learning overtakes hand-built physics?</strong></p>

<hr />

<p><em>The coding was done using <a href="https://claude.com/claude-code">Claude Code</a>.
More about the author at <a href="https://sudshu.github.io/">sudshu.github.io</a>.</em></p>

<p><em>The views and opinions expressed in this article are those of the author
alone and do not reflect those of the JPL, NASA and CALTECH.</em></p>]]></content><author><name>Sudhanshu Pandey</name></author><category term="machine-learning" /><category term="fluid-dynamics" /><category term="NWP" /><category term="waterfall" /><summary type="html"><![CDATA[How much waterfall does a neural network need to see before it overtakes a physics-based forecast? A toy experiment on a 60-second Bridalveil Falls clip.]]></summary><media:thumbnail xmlns:media="http://search.yahoo.com/mrss/" url="https://sudshu.github.io/assets/figures/og_card.png" /><media:content medium="image" url="https://sudshu.github.io/assets/figures/og_card.png" xmlns:media="http://search.yahoo.com/mrss/" /></entry></feed>