Taking Earth's carbon pulse from space: what OCO-2 says about how fast CO2 is building up
Fossil-fuel emissions rose only about 1% from 2024 to 2025 (Global Carbon Budget 2025 projection), yet the pace at which CO2 piled up in the air nearly halved, from 3.47 to 1.96 parts per million a year. NASA's OCO-2 satellite lets us watch these swings month by month.
Emissions are steady. The growth rate is not.
Monthly CO₂ growth in the whole atmosphere, measured by OCO-2, against what we emit
- Growth (OCO-2, GRESO)
- provisional
- early estimate
- Emitted: fossil + land use (dashed: low-latency)
- stayed in the air
- taken up by land and ocean
ppm per year, seasonal cycle removed
Hover or tap the chart, or focus it and use the arrow keys, to read monthly values.
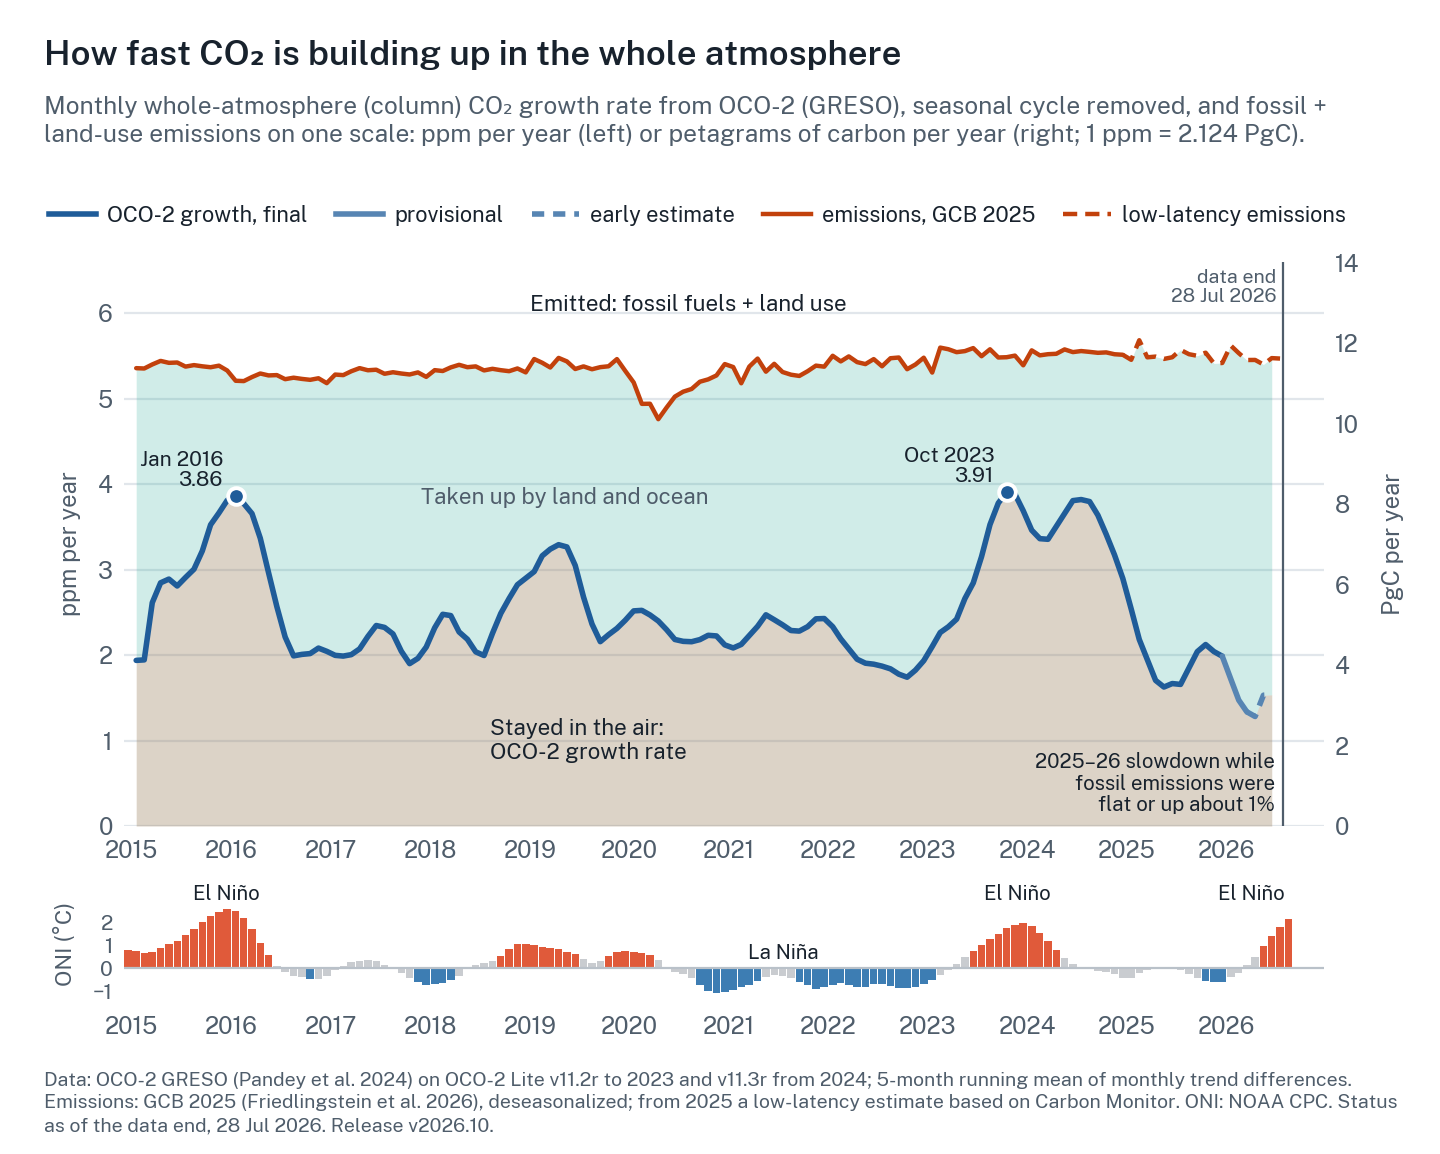
The data payload is missing from this copy of the page, so the static figure is shown instead.
Why it wobbles
When the tropics get hot and dry, plants grow less, soils release more carbon and fires burn. El Niño brings exactly that, and within a few months CO₂ builds up faster.
Most of the year-to-year swing comes from tropical land. During El Niño, rain shifts away from the Amazon, Southeast Asia and parts of Africa and temperatures rise, so forests take up less carbon, soils breathe out more and fires spread (Liu et al., 2017). The ocean partly pushes back, releasing less CO₂ from the eastern equatorial Pacific (Chatterjee et al., 2017).
Figure 1 shows both big El Niños in the OCO-2 record as peaks: 3.86 ppm per year in January 2016 and 3.91 in October 2023. Over 2015–2024 emissions stayed within a few percent of 11.4 PgC per year, while the growth rate ranged from 1.9 to 3.5 ppm per year. On average about half of what we emit stays airborne, 0.49 over 2015–2024 from OCO-2, but in 2024 this airborne fraction was 0.63.
2024 did not follow the script: growth stayed near 3.8 ppm per year into mid-2024, after El Niño had faded. For 2023, studies point to Amazon drought, Canadian fires and a weak eastern-Amazon sink (Ke et al., 2024; Feng et al., 2025). For 2024, they point to land acting as a net source (Ciais et al., 2026) and a jump in ecosystem respiration under hot, wet conditions (Dong et al., 2026).
Then 2025 swung the other way. With El Niño over, the Pacific stayed neutral for most of the year and turned weakly La Niña only late in 2025 (the Oceanic Niño Index reached −0.61 °C in October–December). With the land sink recovering, growth fell to 1.96 ppm per year, the second-lowest OCO-2 year after 2022, while fossil emissions rose about 1% by the Global Carbon Budget's projection (the low-latency estimate in Figure 1 is nearly flat).
Deeper dive: units, the budget identity and the airborne fraction
Units. 1 ppm yr−1 ≈ 2.124 PgC yr−1 ≈ 7.8 GtCO₂ yr−1; 1 PgC = 1 GtC = 3.664 GtCO₂; 1 ppm month−1 = 25.5 PgC yr−1. The factor 2.124 is the budget convention (Ballantyne et al., 2012).
Airborne fraction. The denominator is Global Carbon Budget 2025 fossil CO₂ (before the carbonation sink) plus land use. For 2025, Carbon Monitor fossil × 1.020 plus extrapolated land use, so AF2025 = 0.36 is provisional. Uncertainty is about ±0.04 per year (our estimate), mostly from land use.
A subtlety. k assumes the change is spread through the whole atmosphere. That holds for a mass-weighted column, but only approximately for surface air, because the stratosphere lags the surface by years (Pandey et al., 2025).
Deeper dive: how big, and how late, is the El Niño effect?
Lag. Published lags between tropical Pacific temperature and CO₂ growth run from about 3 months at Mauna Loa (Jones & Cox, 2005) to about 6 months (Wang et al., 2013). On this release, monthly OCO-2 growth correlates best with the ONI about 2 months after the index (r ≈ 0.75 from January 2015 to early 2026, early estimates left out; my calculation, and both series are smoothed, so the lag is approximate).
Why a lag? El Niño warms the tropical Pacific first. Over the following months the atmosphere carries heat and drought to tropical land; soil-moisture deficits and fire fuel build through the next dry season, and the extra CO₂ then takes weeks to months to reach remote surface sites. The ocean responds the other way with little delay (less upwelling, less outgassing), which damps the early signal. Our column lag is shorter than the 3–6 months found at the surface, plausibly because the column sees continental air directly; note too that the ONI is a centred three-month mean.
Sensitivity. Jones & Cox found 0.33 ± 0.14 ppm yr−1 per kelvin of Niño-3; Wang et al. found 3.5 ± 0.6 PgC yr−1 per °C of tropical land temperature. The Met Office's annual Mauna Loa forecast regresses on April–March Niño-3.4 (Betts et al., 2016; 2018). These are historical fits; 2024 showed growth can stay high after the index returns to neutral.
How it is measured
For more than 60 years, air samples from remote stations have defined how much CO₂ is in the atmosphere. They still do. From space, OCO-2 measures sunlight reflected from Earth and works out how much CO₂ is in the whole column of air beneath it.
NOAA's Global Monitoring Laboratory builds its global growth rate from a few dozen remote sites that sample the marine boundary layer (MBL): well-mixed air near the ocean surface, far from local sources (Lan, Tans & Thoning).
The surface network is the anchor. Every CO₂ measurement, the satellite's included, is tied to the WMO calibration scale that NOAA maintains, and over five years or more the surface growth rate is extremely accurate. What a few dozen sites cannot do is see the whole atmosphere at once: air over the continents, aloft and in the stratosphere takes weeks to years to reach them. That adds a single-year error that NOAA's own error bar does not include (Pandey et al., 2024).
OCO-2, launched in 2014, repeats its ground track every 16 days and makes millions of small measurements a month. It retrieves XCO₂, the column-average dry-air mole fraction of CO₂. Because XCO₂ is weighted by air mass, its global average is very nearly the whole-atmosphere average, which is exactly what the 2.124 conversion assumes.
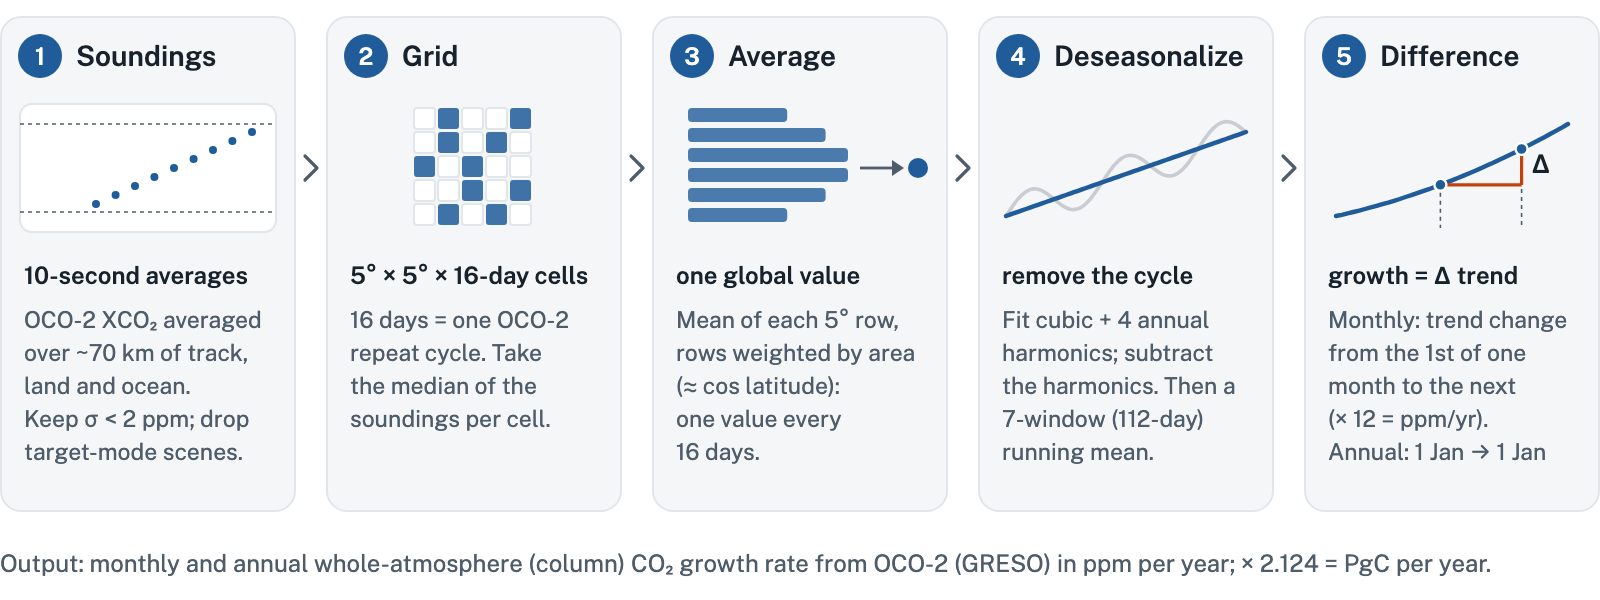
GRESO (Growth Rate from Satellite Observations; Pandey et al., 2024) turns those soundings into one number in five steps (as the code behind these numbers runs them), with no transport model and no inversion (Figure 2).
Deeper dive: the recipe as equations
Where the average is taken. GRESO averages OCO-2 data between 50°S and 50°N (77% of Earth's surface), where coverage is good all year; CO₂ added or removed further poleward mixes into this band within weeks to months, so the result tracks the whole atmosphere.
X(t) is the 16-day, area-weighted mean over that band; τi are window midpoints; tm is 00:00 on the first of month m. The residual R(t) is kept, so anomalies survive; the 2017 gap is filled linearly; T is linearly interpolated to each tm; the plotted monthly series adds a 5-month running mean. The fit is redone over the whole record, so every new data point slightly shifts the whole series. The 2024 paper described a quadratic, a 3-point running median and a 5σ outlier screen; the code behind these numbers uses a cubic and a 7-point running mean and does not apply the outlier screen. Annual values are trend differences, not means of the plotted monthly values (2015: 3.00 vs 2.93).
Does it work?
We tested the method in model atmospheres where the right answer is known, then on real data. It did well in the model test, and in the real record it tracks a second satellite closely and the surface network over several years.
In an observing system simulation experiment (OSSE), ten model atmospheres were sampled exactly where and when OCO-2 and the surface sites measured. GRESO's annual sampling error was 0.04 ppm per year, against 0.12 for the surface network (Pandey et al., 2024). Month to month it tracked the truth with a correlation of 0.76, against 0.47.
In the real record for 2015–2025, OCO-2 and Japan's GOSAT satellite, run through the same method, agree to 0.08 ppm per year (root-mean-square difference). OCO-2 and NOAA differ by 0.21 (GOSAT and NOAA by 0.23), yet their 2015–2024 averages are nearly identical: 2.61 and 2.62 (Figure 3). GOSAT shares the ACOS retrieval and bias correction with OCO-2, so it is a cross-check, not a fully independent one.
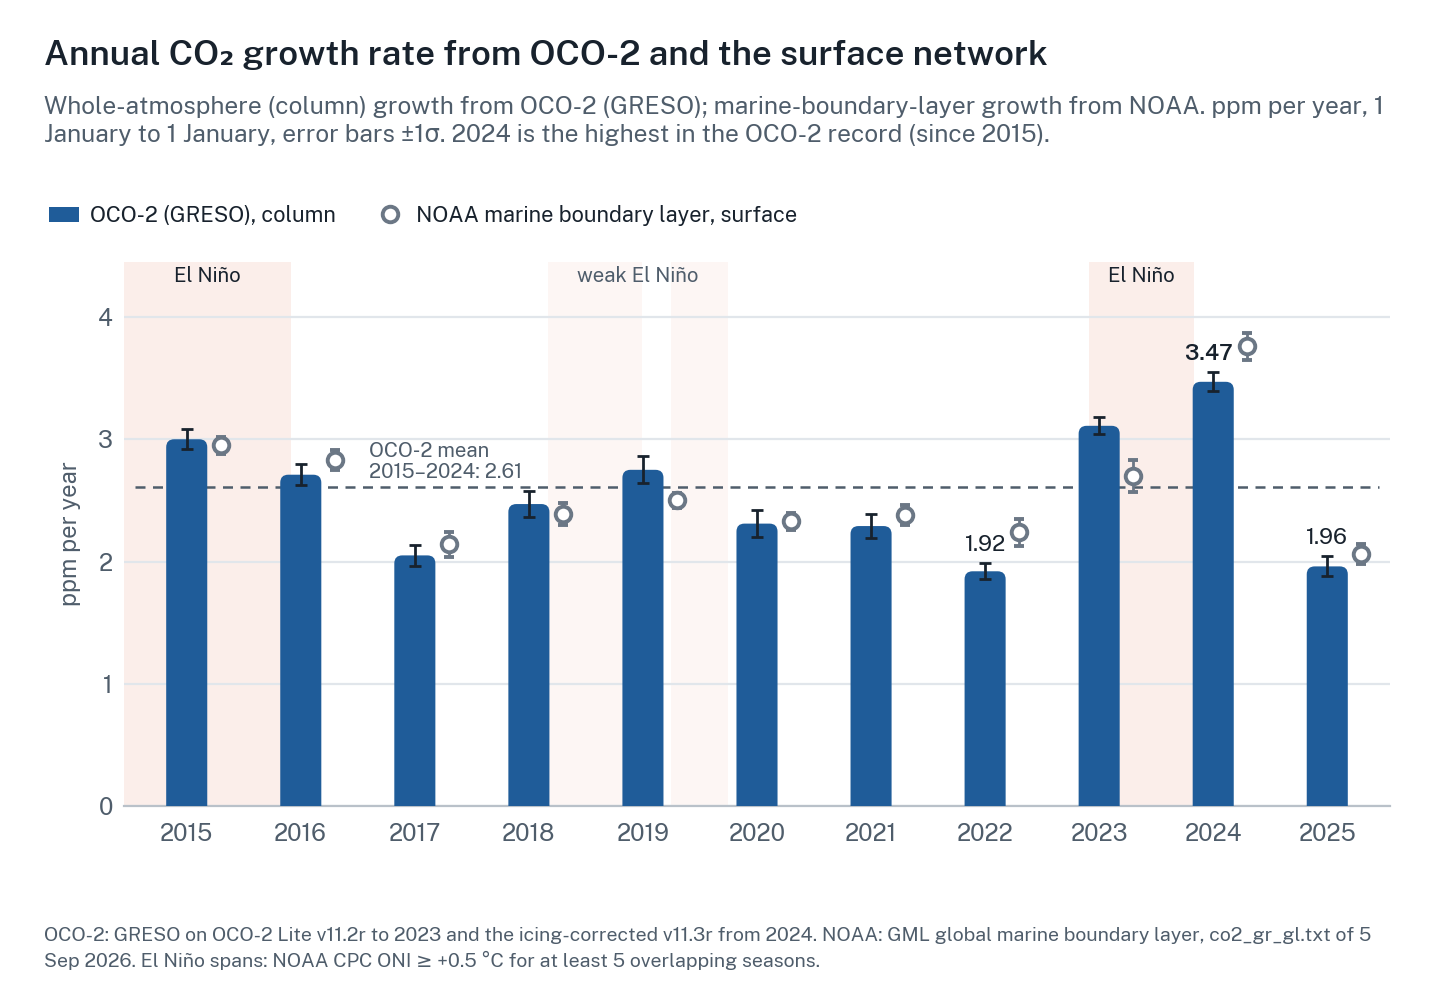
OCO-2 minus NOAA was −0.32 ppm per year in 2022, +0.41 in 2023 and −0.29 in 2024. Summed over 2022–23 or 2023–24, the two agree to about 0.1 ppm. Alternating signs point to timing. Two effects pull in opposite directions. Remote marine sites see a tropical-land pulse only after winds carry it to them, so the column can run ahead. Meanwhile the stratosphere takes years to catch up, so in a big year surface air can overshoot the whole-atmosphere change (Pandey et al., 2024; 2025). Which effect wins depends on the year.
It matters for the carbon budget. For 2024 the Global Carbon Budget 2025 found an imbalance of −1.7 PgC per year and noted that either the sinks or the atmospheric growth may be overestimated that year (Friedlingstein et al., 2026). Using whole-atmosphere growth from inversions in place of surface growth cut the long-term imbalance by about a quarter (Pandey et al., 2025).
Deeper dive: column versus surface, and why two-year sums agree
Physics. OCO-2's averaging kernel is close to 1 in the lower troposphere and about 0.5 in the lower stratosphere. Air mixes between hemispheres in about a year and into the stratosphere over about 2.5 years. Two timing effects therefore compete: horizontal transport delays continental pulses at remote marine sites (the column leads), while slow exchange with the stratosphere lets surface air overshoot the column in anomaly years (the surface leads). Above the tropopause the retrieval leans partly on its prior profile, whose trend is tied to surface records, so even the satellite's "whole atmosphere" is partly anchored to the in situ network.
Telescoping. Consecutive annual values share an endpoint on the same trend curve:
An error in a 1 January level pushes one year up and the next down, so adjacent-year errors anticorrelate and multi-year means converge fast. Timing differences mostly move CO₂ between adjacent years, so they largely cancel in a two-year total: once a pulse has mixed through, both records count nearly the same mass. The √2·σlevel/n form is our own back-of-envelope result, assuming independent endpoint errors.
The catch: biases that drift
A satellite with a constant error still gets the growth rate right, because the error cancels when you subtract one year from the next. Errors that change over time do not cancel.
The 2024 number is a live example. In 2024 ice slowly built up on the OCO-2 detectors, and the older data drifted slightly low. The corrected v11.3r data give 3.47 ± 0.08 ppm per year. The drift was less than 0.1% of the roughly 420 ppm column: this is how small a drift has to be to matter. Retrieval versions matter: this release uses the icing-corrected v11.3r data from 1 January 2024, and values can shift when OCO-2 data are reprocessed.
The uncertainty estimate covers biases that track known retrieval parameters, not instrument drifts like the icing. Drifts are caught by cross-checks: GOSAT, ground-based TCCON columns tied to the WMO scale, and steps in GRESO itself.
The newest months are provisional or early estimates and will be revised. A first monthly estimate is ready about 6–8 weeks after the month ends, and it settles after about 4–6 months. The running mean is incomplete at the record's end and the seasonal fit is redone with each new point.
Deeper dive: how the uncertainty is built
Retrieval. The chain is rerun on 40 subsets: deciles of four bias-related retrieval parameters (dpfrac, dp_sco2, albedo_wco2, co2_grad_del). σret is their spread, a stratified subsetting rather than a bootstrap, and conservative because each member sees a tenth of the data. Smoothing: spread over six trend smoothing widths (1 to 11 windows). Sampling: 0.04 from the model test. Together, 46 members per year.
The total averages 0.09 ppm yr−1; for 2024 the parts are 0.07, 0.01 and 0.04. GOSAT has no retrieval term (0.08 floor). Monthly values carry no formal uncertainty; the model test suggests about 0.75 ppm yr−1.
What it does not cover: drifts that do not track those four parameters (the 2024 icing is the example), and the land/ocean and data-gap terms, which exist in the code but are switched off in this release.
Where it happens
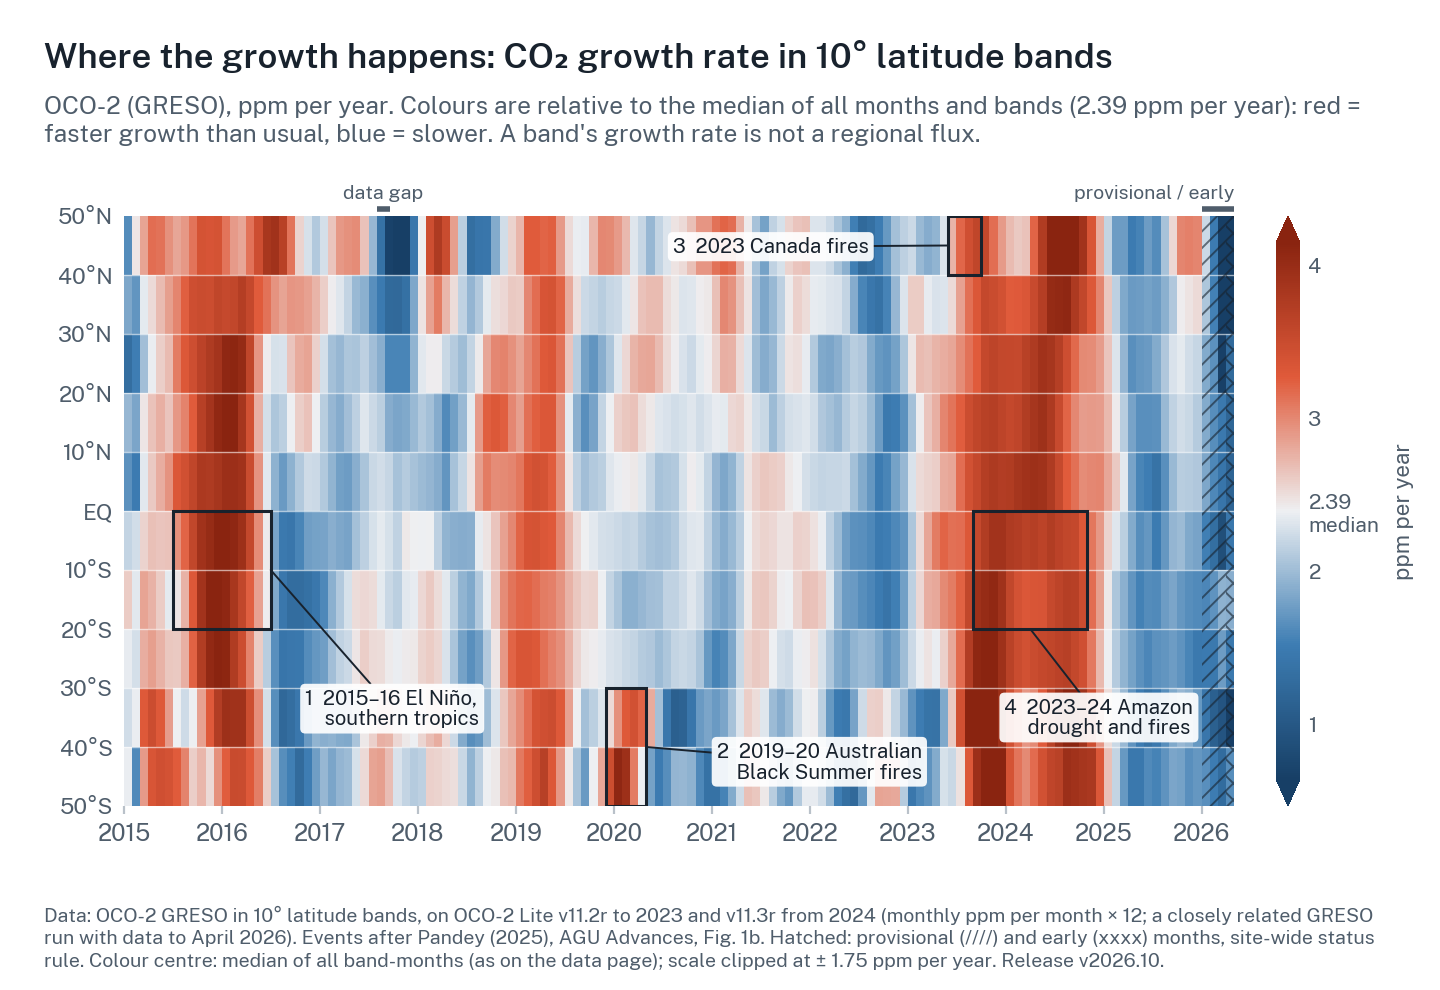
Splitting the globe into latitude bands shows where CO₂ in the air rose faster or slower.
Run a closely related calculation on ten 10° latitude bands (Figure 4; red is faster growth than usual, blue slower) and known events stand out: the 2015–16 El Niño in the southern tropics, the 2019–20 Black Summer fires in Australia (van der Velde et al., 2021), the 2023 Canadian fires (Byrne et al., 2024; the fires were further north, so their CO₂ shows up as it drifts into the northernmost band) and the 2023–24 Amazon drought and fires.
A band's growth rate is not a regional flux. Winds move CO₂ between bands within weeks to months, so this is a fingerprint rather than an account. Blue means slower than usual; it does not mean that region took up CO₂.
Takeaway
It isn't satellite versus ground; it's both. The surface network anchors the long-term trend and the calibration scale that every CO₂ measurement relies on. The satellite sees the whole column, fills the gaps between stations, and adds a monthly, latitude-resolved view, with a first estimate about two months after each month ends. GRESO already appears as a column in the Global Carbon Budget 2025, next to NOAA (Friedlingstein et al., 2026). Together they show the carbon cycle's pulse: a steady push from our emissions, and a large, fast, climate-driven response from land and ocean.
Get the data
Get the data → Monthly and annual growth rates with uncertainty and status flags, latitude bands and the 16-day series. Release v2026.10.How to cite
Pandey, S., O'Dell, C. W., Frankenberg, C., Liu, J., Payne, V. H., & Wennberg, P. O. (2026). GRESO OCO-2 whole-atmosphere CO₂ growth rates, release v2026.10. OCO Science Applications and Partnerships Center, Caltech. [dashboard base URL]. [data DOI].
Method: Pandey, S., Miller, J. B., Basu, S., Liu, J., Weir, B., Byrne, B., Chevallier, F., Bowman, K. W., Liu, Z., Deng, F., O'Dell, C. W., & Chatterjee, A. (2024). Toward low-latency estimation of atmospheric CO2 growth rates using satellite observations: Evaluating sampling errors of satellite and in situ observing approaches. AGU Advances, 5, e2023AV001145. doi.org/10.1029/2023AV001145
Further reading
Further reading (26 references)
My own, in this lineage
- Pandey et al. (2024), Toward low-latency estimation of atmospheric CO₂ growth rates using satellite observations: evaluating sampling errors of satellite and in situ observing approaches. AGU Advances, 5, e2023AV001145. doi
- Pandey et al. (2025), Reduction in Earth's carbon budget imbalance. Nature Communications, 16, 6818. doi
- Pandey (2025), Taking Earth's carbon pulse from space. AGU Advances, 6, e2025AV002085. doi
The carbon budget and the surface record
- Friedlingstein et al. (2026), Global Carbon Budget 2025. Earth System Science Data, 18, 3211–3288. doi; data doi
- Lan, Tans & Thoning, Trends in globally-averaged CO₂ determined from NOAA Global Monitoring Laboratory measurements. doi; NOAA GML growth-rate page
- Ballantyne et al. (2012), Increase in observed net carbon dioxide uptake by land and oceans during the past 50 years. Nature, 488, 70–72. doi
- Liu, Z. et al., Carbon Monitor: near-real-time daily fossil CO₂ emissions. carbonmonitor.org; arXiv:2004.13614
Satellite data
- OCO-2 Lite XCO₂ v11.2r, NASA GES DISC. doi:10.5067/70K2B2W8MNGY
- OCO-2 Lite XCO₂ v11.3r, NASA GES DISC. doi:10.5067/C4OENLFCYVSA
- ACOS GOSAT Lite XCO₂ v11, NASA GES DISC. doi:10.5067/UAY6VJYTS8OD
El Niño and the carbon cycle
- Liu, J. et al. (2017), Contrasting carbon cycle responses of the tropical continents to the 2015–2016 El Niño. Science, 358, eaam5690. doi
- Chatterjee et al. (2017), Influence of El Niño on atmospheric CO₂ over the tropical Pacific Ocean. Science, 358, eaam5776. doi
- Jones & Cox (2005), On the significance of atmospheric CO₂ growth rate anomalies in 2002–2003. Geophysical Research Letters, 32, L14816. doi
- Wang, W. et al. (2013), Variations in atmospheric CO₂ growth rates coupled with tropical temperature. PNAS, 110, 13061–13066. doi
- Betts et al. (2016), El Niño and a record CO₂ rise. Nature Climate Change, 6, 806–810. doi; Betts et al. (2018), Phil. Trans. R. Soc. B, 373, 20170301. doi
The 2023–24 surge and other events
- Ke et al. (2024), Low latency carbon budget analysis reveals a large decline of the land carbon sink in 2023. National Science Review, 11, nwae367. doi
- Ciais et al. (2026), National Science Review, 13, nwaf594 (the 2024 carbon budget; land as a net source). doi
- Feng et al. (2025), Atmospheric Chemistry and Physics, 25, 13053–13076 (the 2023 growth-rate increase and the eastern Amazon). doi
- Dong et al. (2026), Nature Communications, 17, 5436 (the 2024 record and ecosystem respiration). doi
- Byrne et al. (2024), Carbon emissions from the 2023 Canadian wildfires. Nature, 633, 835–839. doi
- van der Velde et al. (2021), Vast CO₂ release from Australian fires in 2019–2020 constrained by satellite. Nature, 597, 366–369. doi
- Bastos et al. (2020), Science Advances, 6, eaba2724 (the 2018 European drought). doi
- Liu, J. et al. (2024), Science Advances, 10, eadl2201 (the 2021 La Niña). doi
Using the growth rate
- Peters et al. (2017), Towards real-time verification of CO₂ emissions. Nature Climate Change, 7, 848–850. doi
- Wuebbles (2024), Using satellite data to estimate atmospheric CO₂ growth rates. Eos Editors' Highlight. eos.org
- Davidson (2025), Taking carbon science out of orbit. Eos Editors' Highlight on Pandey (2025), 12 November 2025. [Eos link]