Sudhanshu Pandey

Scientist, Earth Science Section, NASA Jet Propulsion Laboratory, California Institute of Technology

My research has focused on the carbon cycle, atmospheric composition, and satellite remote sensing for more than a decade. I now develop machine learning and agentic AI methods that extract new physical information from Earth observations and help uncover the mechanisms driving carbon-cycle and atmospheric change.

Sudhanshu Pandey

Writing

Research

How fast CO2 is building up in the atmosphere

Satellites such as NASA’s OCO-2 measure carbon dioxide all over the globe. I developed methods to estimate the growth rate of atmospheric CO2 from satellite observations.

They give an early, independent measure of how fast CO2 is building up in the atmosphere, which, compared with emissions, shows how much of what we emit stays in the air.

Papers

Also: The Tale of the Traveling CO2, a short poem about this work.
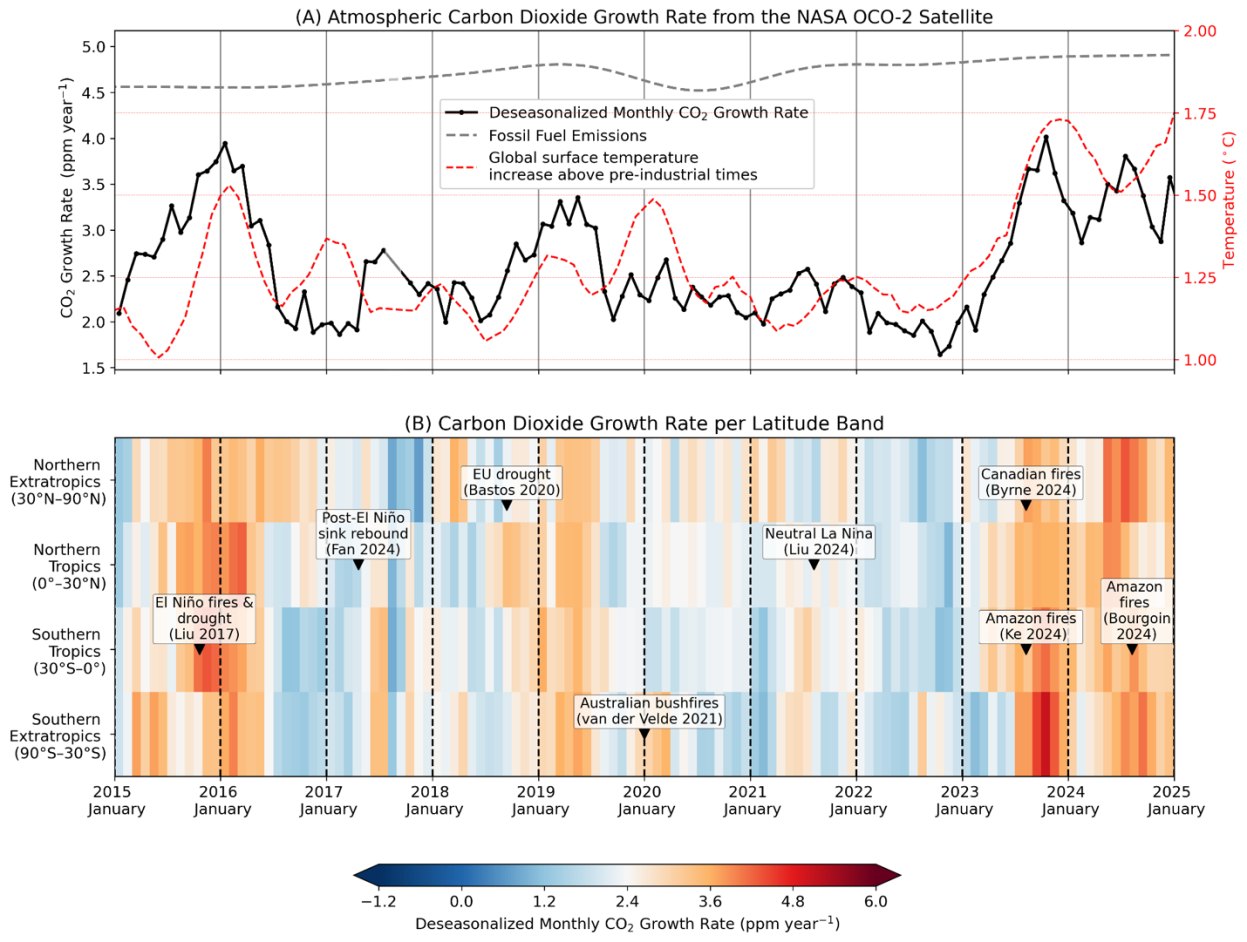
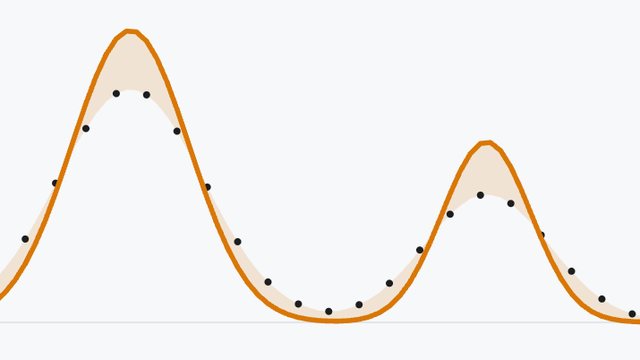
Two panels. Top: deseasonalized monthly CO2 growth rate from NASA's OCO-2 satellite, 2015 to 2025, shown with fossil fuel emissions and global surface temperature. Bottom: the growth rate in four latitude bands, with labeled events such as El Niño fires and drought, the Canadian fires, and Amazon fires.
Monthly CO2 growth rate from NASA’s OCO-2 satellite, for the whole globe (top) and by latitude band (bottom). From Pandey (2025), AGU Advances, CC BY-NC.

Finding methane leaks from space

Methane is a strong greenhouse gas, and large leaks can go unnoticed on the ground. I led the first satellite detection of a previously unreported extreme methane release, which came from a natural gas well blowout in Ohio. It helped establish the potential of satellite observations for identifying large methane point sources, and satellites are now widely used to find such leaks so they can be fixed.

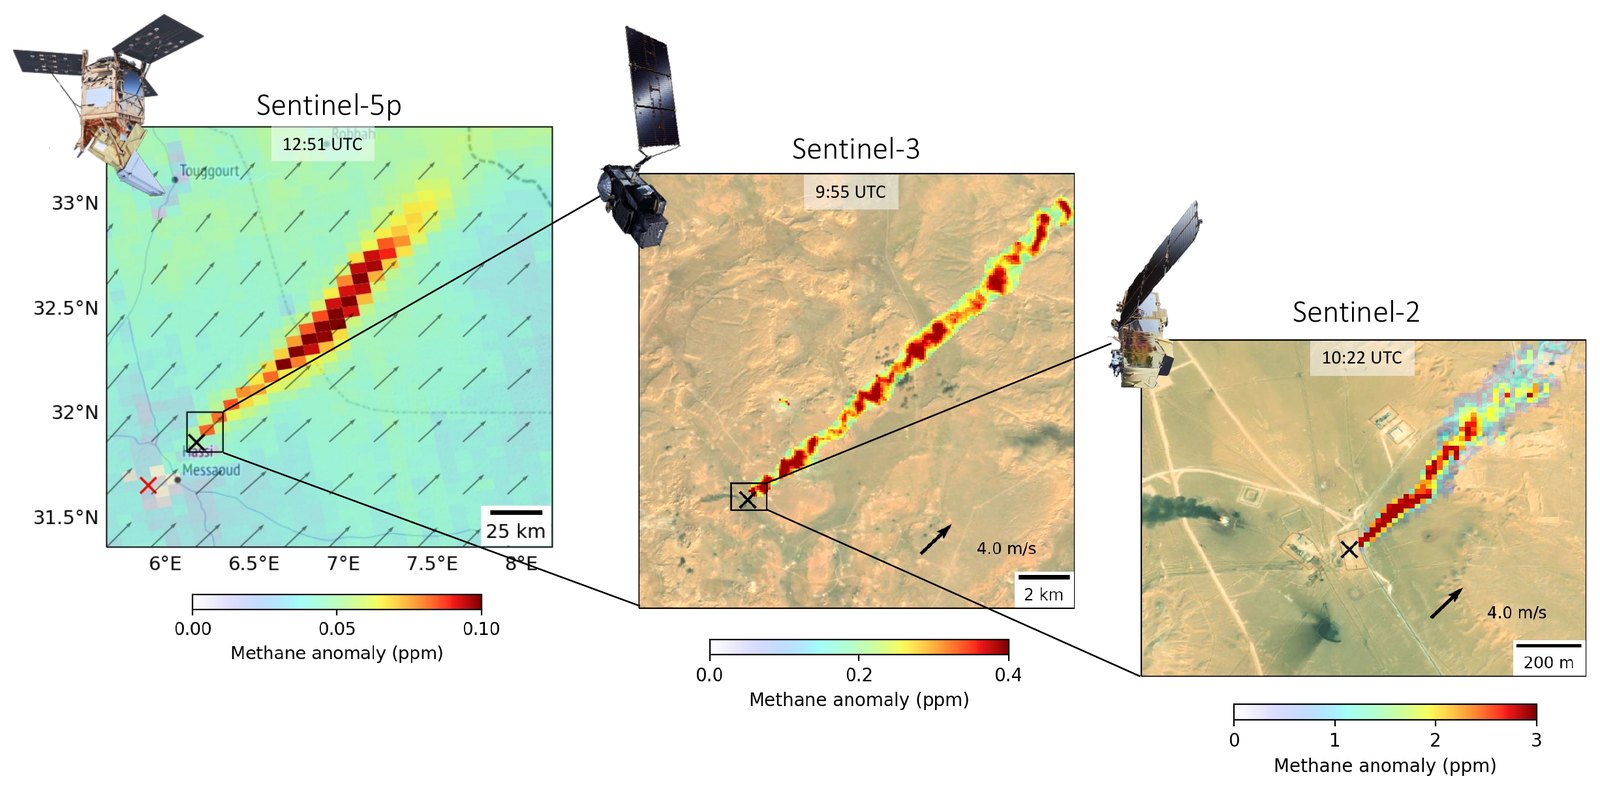
In later work, I showed how three satellites can work together: Sentinel-5P scans the whole globe every day for large plumes, Sentinel-3 sees them daily in finer detail, and Sentinel-2 pinpoints the facility responsible, as in the example shown here.

Papers

Three satellite views of one methane plume near Hassi Messaoud, Algeria. Left: a Sentinel-5P map with a long plume blowing to the northeast. Middle: a Sentinel-3 view zoomed in on the plume. Right: a Sentinel-2 view zoomed in on the source facility.
The same methane plume near Hassi Messaoud, Algeria, seen by three satellites on 4 January 2020: Sentinel-5P (left), Sentinel-3 (middle), and Sentinel-2 (right), each zooming in on the source. From Pandey et al. (2023), Remote Sensing of Environment.

Learning about winds from air-pollution maps

Preprint, under review

We can’t see the wind, but we can see what it carries. Smoke, smog, and other gases are pushed and stirred by the wind, so their patterns keep a record of how the air has moved. In COMPASS, I asked whether satellite maps of air pollution can tell us about the winds and mixing that shaped them.

Using machine learning, the study finds that snapshots of atmospheric composition carry information about the winds and the depth of the well-mixed layer of air near the ground, both in global model simulations and in real observations from NASA’s TEMPO mission, which was built to measure air pollution, not winds. This suggests that composition satellites could become a new source of information for weather and air-quality forecasting.

Paper

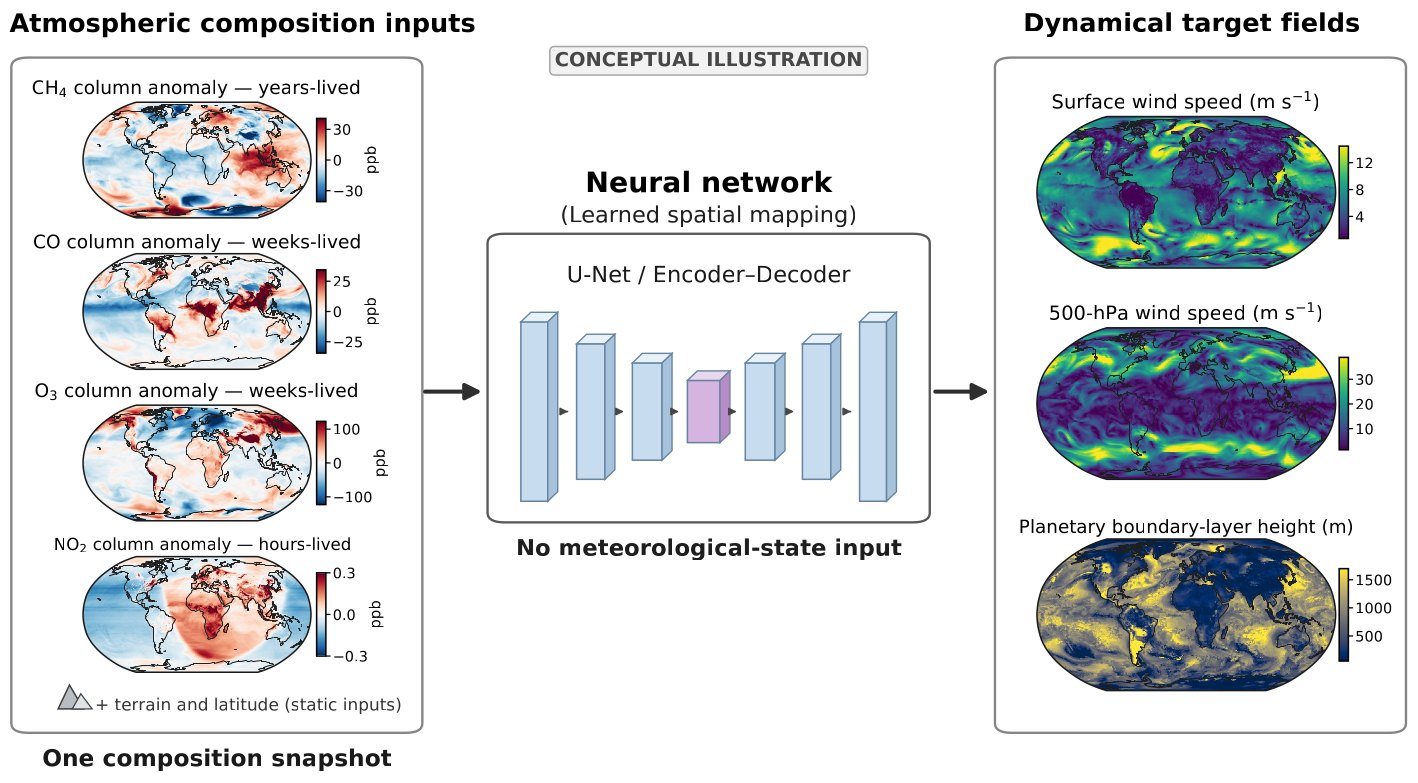
Diagram. Left: four global maps from one snapshot of atmospheric composition, showing methane, carbon monoxide, ozone, and nitrogen dioxide. Middle: a neural network. Right: the fields it maps them to: surface wind speed, 500 hPa wind speed, and boundary-layer height.
How COMPASS works: a neural network takes one snapshot of methane, carbon monoxide, ozone, and nitrogen dioxide from a global model, plus terrain and latitude, and maps it to winds and boundary-layer height, with no wind or other weather data as input. The maps on the right are the target fields, not predictions. Conceptual illustration from Pandey (2026), preprint under review.

Interactive explainers

Inverse Modeling Explorer

One set of observations can support many possible explanations. Rotate solution spaces, compare predictions, and explore inverse modeling through land carbon, atmospheric gases, and emissions.

Other interests

  • Agentic AI that helps with research, from forming hypotheses to weighing evidence, while scientists make the key decisions.
  • Machine learning and data-driven equation discovery: finding simple equations behind patterns in Earth observations.
  • Inverse modeling and Bayesian optimization, and visualizing their solution spaces: the many combinations of parameters that can explain the same observations.
  • The philosophy of science and AI: what counts as understanding, and how prediction relates to explanation.

About

I am a scientist in the Earth Science Section at NASA’s Jet Propulsion Laboratory, where I have worked since 2022. From 2016 to 2022, I was a scientist at SRON, the Netherlands Institute for Space Research. I did my PhD in physics at the Institute for Marine and Atmospheric Research Utrecht, Utrecht University (2017), and a combined BS-MS degree in Earth Sciences at the Indian Institute of Science Education and Research (IISER) Kolkata (2012).